
You check your Shopify dashboard and see that average order value has moved upward. That sounds positive, until you notice that the increase came from deeper discounts, more returns, or a post-purchase product change that Shopify's original AOV doesn't fully reflect. The number changed, but the business outcome is still unclear.
Shopify average order value becomes useful when you treat it as a diagnostic signal, not a score to chase. It can show how product mix, pricing, cart design, promotions, and customer behavior are interacting. It can also expose a gap between the value Shopify reports for an original order and the value your store ultimately realizes after edits, refunds, shipping, and taxes.
Table of Contents
- Why AOV Matters More Than You Think
- How Shopify Calculates Average Order Value
- Benchmarks That Actually Apply to Your Store
- The Levers That Move AOV on a Shopify Store
- Reading AOV Inside Your Shopify Analytics
- Where AOV Falls Short as a Standalone KPI
- Setting an AOV Target You Can Actually Defend
Why AOV Matters More Than You Think
Average order value answers a simple question: how much value does a typical order contain? That question affects more decisions than many merchants realize. It can influence how much acquisition cost an order can support, whether a free-shipping goal is sensible, which products deserve bundle treatment, and where an upsell belongs in the buying journey.
Suppose a founder raises AOV by offering a larger discount when customers add more items. The dashboard moves in the desired direction, but contribution margin falls because the extra revenue came at too high a discount. In another store, AOV rises because shoppers choose a premium variant. That movement may represent healthier merchandising, even though both scenarios produce a higher headline number.
Practical rule: A higher AOV is only good when the extra order value supports the economics and customer experience you need.
AOV also helps you read the storefront as a sequence of decisions:
- Product mix: Are shoppers adding complementary products or choosing higher-priced versions?
- Pricing: Does the offer encourage a larger basket without giving away unnecessary margin?
- Cart experience: Does the cart drawer make relevant additions easy to understand?
- Shipping policy: Does the shipping threshold encourage a useful next purchase?
- Customer behavior: Do new and returning customers build baskets differently?
The metric is particularly helpful when paired with conversion rate, refund activity, discount cost, and contribution margin. A cart experiment that increases AOV while reducing completed purchases may not improve the store. Conversely, a modest AOV movement from a relevant bundle may create a more durable improvement in order composition.
Merchants also need to separate reported AOV from realized order value. Shopify's native figure is designed for consistent reporting on original orders. Your operational view may need to account for what happened afterward, including returns, exchanges, quantity changes, and additional payments.
By the time you've finished interpreting the metric, you should be able to calculate it consistently, compare it with a relevant peer group, identify the storefront lever most likely to move it, and judge the result without mistaking a larger number for a healthier business.
How Shopify Calculates Average Order Value
Think of a coffee shop receipt. If one customer buys only a drink and another buys a drink plus food, the average receipt tells the manager something about typical basket size. It doesn't explain profit by itself, but it gives the team a consistent way to compare periods and merchandising choices.
Shopify uses a defined version of that idea. Its formula is:
AOV = (gross sales minus discounts) ÷ number of orders
Shopify excludes taxes, shipping, and post-order adjustments, including returns, edits, and exchanges, from this calculation. That makes the metric useful for analyzing the original cart and merchandising experience, but it means AOV isn't the same as cash ultimately retained by the business. Shopify describes this treatment in its basic ecommerce metrics guidance.
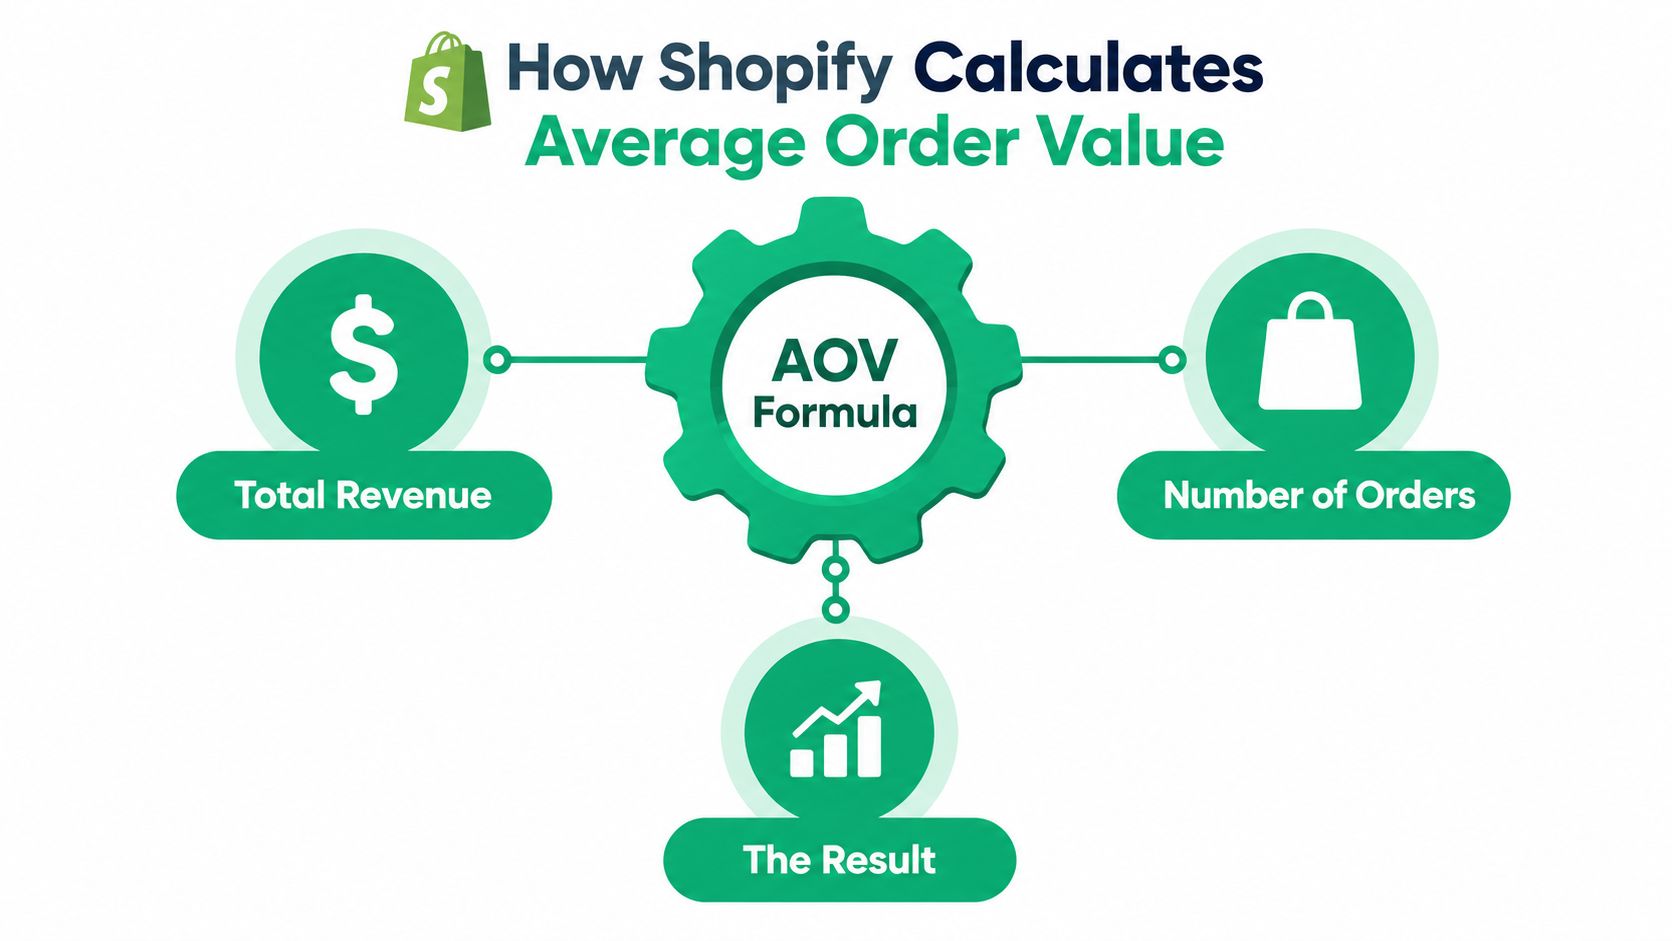
Use the following example. A merchant records $50,000 in gross sales after $5,000 in discounts across 500 orders. The calculation is:
($50,000 - $5,000) ÷ 500 = $90
The resulting Shopify AOV is $90. The figure reflects the sales and discounts assigned to those original orders. It doesn't add shipping or taxes, and it doesn't revise the historical result when a customer later changes the order.
What the formula includes and excludes
| Component | Counts Toward Shopify AOV | Counts Toward Realized Order Value |
|---|---|---|
| Product sales on the original order | Yes | Yes |
| Discounts applied to the original order | Deducted | Deducted |
| Taxes | No | Yes, where applicable |
| Shipping charges | No | Yes, where applicable |
| Returns and refunds after the order | No | Yes |
| Exchanges and product swaps | No | Yes |
| Post-purchase quantity changes | No historical revision | Yes |
| Additional payment collected later | No historical revision | Yes |
The operational consequence matters. A post-purchase swap or quantity increase can change inventory, fulfillment, payment collection, and customer service workload without changing the original period's Shopify AOV. Shopify's sales report documentation explains why the native metric should be kept separate from an adjusted realized figure.
For clean reporting, maintain both measures. Use Shopify-native AOV for consistent dashboard comparisons, then track adjusted realized order value for the commercial outcome. Keep the same treatment of discounts and adjustments whenever you compare periods, or a reporting change may look like a merchandising improvement.
Benchmarks That Actually Apply to Your Store
A benchmark becomes useful only when the comparison group resembles your store. A fashion merchant shouldn't judge performance against a blended figure that includes furniture, supplements, and food. Product prices, purchase frequency, bundle potential, and customer intent can vary sharply by category.
A 2026 benchmark compiled from 426 Shopify stores reported a median AOV of $107, with the top 20% exceeding $283 and the top 10% reaching at least $597. The dataset used purchase revenue divided by orders in U.S. dollars over a 90-day period, so it represents a defined sample and measurement window, not every Shopify merchant worldwide. See the Shopify AOV benchmark dataset from Littledata for the methodology and segmentation.
Category matters first
The same benchmark shows why a category peer group is more informative than a universal target:
| Category | Median AOV (USD) |
|---|---|
| Home and furniture | $237 |
| Fashion and apparel | $102 |
| Food and beverage | $81 |
| Health and supplements | $75 |
| Beauty and skincare | $68 |
A beauty store sitting near its category median may be operating in a very different way from a furniture store near its own median. The numbers shouldn't become automatic targets. They should prompt better questions about product mix, price architecture, repeat purchasing, and the type of customer entering the store.
Device segmentation adds another layer. The benchmark reported a mobile median of $101 and a desktop median of $116, with desktop approximately 14.9% higher relative to the mobile benchmark. That gap doesn't prove that desktop shoppers are more valuable in every store, but it does justify checking whether mobile shoppers see the same product information, bundle prompts, cart visibility, and shipping messaging.
Compare like with like: Use category, device, market, and customer type before deciding whether your AOV is high or low.
A 90-day window can provide a practical comparison frame because it smooths some short-term order variation while remaining recent enough for current merchandising and traffic conditions. Keep your own measurement window consistent, then compare your store with the closest category and customer mix available. For a broader view of how AOV fits alongside conversion analysis, use NanoPIM's ultimate guide to conversion rate.
The Levers That Move AOV on a Shopify Store
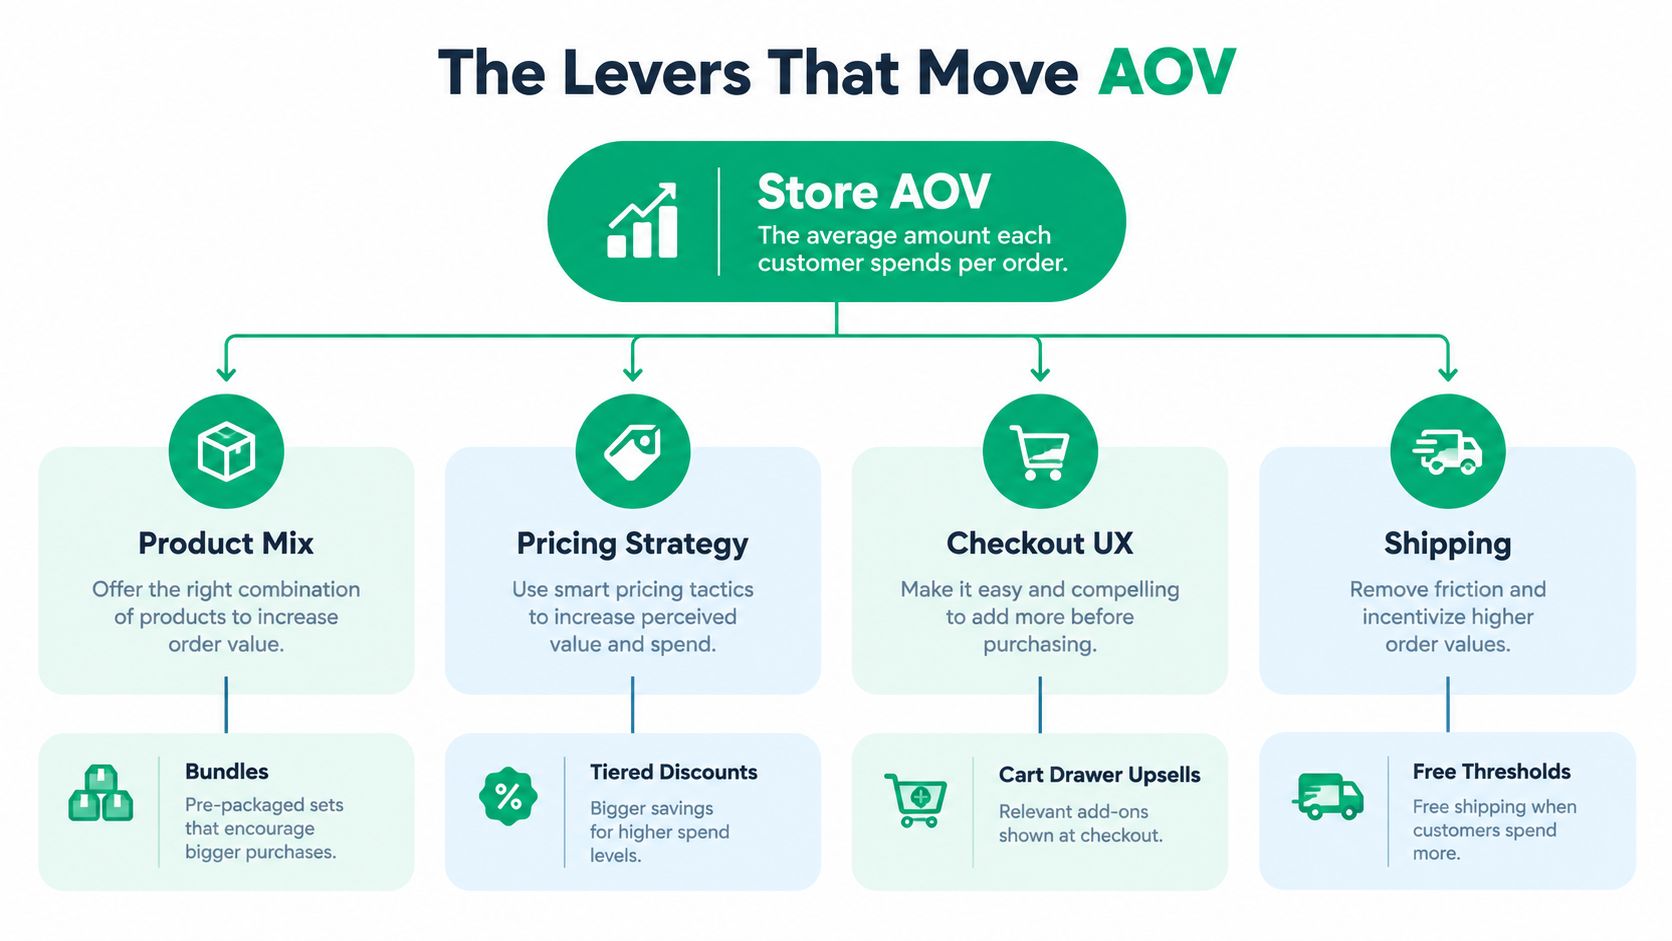
AOV moves when the basket changes. In practice, that usually means a shopper adds one more item, chooses a higher-value version, or crosses a shipping threshold that makes a larger order feel reasonable. Your job is not to force a bigger cart. It is to make the next sensible purchase decision easy to see.
Start with product mix. A good bundle works like a ready-made kit. It groups products that solve the same problem, such as a main item with a refill, accessory, or care product that fits it. Cart recommendations do the same job later in the journey, after the shopper has already shown buying intent. The offer should feel obvious at a glance. If a customer has to stop and decode the promotion, the extra item often loses momentum.
Then look at pricing strategy. Quantity breaks and tiered discounts can raise order value, but they only help when the extra units create enough additional revenue to justify the discount. A larger basket can still be a weak commercial result if margin shrinks too far. This is why AOV work belongs to operations as much as merchandising. The order total is only one part of the outcome.
Shipping is another practical lever. A progress bar or spend-to-get threshold gives the shopper a clear target, much like a basket that is almost full in a grocery run. People often need a reason to add one more item now instead of postponing it. The threshold has to fit your catalog and normal buying pattern, though. If the target sits too far above the customer's likely spend, the message creates friction instead of momentum.
Checkout experience decides whether these prompts feel useful or disruptive. One clear recommendation at a high-intent moment usually works better than stacking multiple offers. Keep the main purchase path visible. Then measure whether the recommendation created additional product revenue, or only shifted spend from one item to another.
Judge the lever by the full outcome
Use a small operating scorecard for each test:
- Incremental product revenue: What extra items, upgrades, or quantity increases did the offer create?
- Discount cost: How much value did you give up to get that movement?
- Refund and return risk: Did the offer change order quality or create more later adjustments?
- Conversion behavior: Did shoppers still complete the original purchase?
- Fulfillment impact: Did the offer add picking, packing, inventory, or shipping complexity?
Post-purchase changes need separate handling. Shopify's native AOV is tied to the original order record, so post-purchase swaps, quantity increases, and cancellations can change inventory and fulfillment economics without changing the historical AOV shown for that period. That is where the operational view matters. Track a realized order value alongside Shopify's native figure so you can see what the store reported and what the order actually became. A tool such as ServeApps can support cart experiences, upsell popups, and controlled post-purchase order changes, but each offer still needs to earn its place through commercial and operational results.
For practical storefront patterns, review these examples of product recommendations for Shopify. If you want outside context before setting targets, use Arlo Inc.’s guide to benchmark your AOV.
Here's a visual walkthrough of how these levers can fit into a Shopify storefront:
Reading AOV Inside Your Shopify Analytics
Shopify's analytics gives you the headline metric, but the useful work starts after you open it. Begin with the relevant sales or analytics report and select a date range that matches the comparison you want to make. A before-and-after view is only meaningful when both periods use the same discount treatment and adjustment rules.
Then narrow the view. Compare AOV by:
- Device: Look for differences between mobile and desktop basket composition.
- Channel: Separate paid, organic, email, direct, and other acquisition contexts where available.
- Product category or collection: Identify which merchandise groups pull the average upward or downward.
- Customer type: Compare first-time and returning customers rather than treating all orders as one audience.
- Market: Check whether currency, shipping expectations, and product availability affect basket size.
A single store-wide AOV can hide opposing movements. One collection may be producing larger baskets while another is losing add-on sales. Mobile AOV may be lower because product recommendations are harder to see, or because the mobile cart makes quantity changes less convenient. A channel with a strong average may also carry higher discount costs.
Build a simple comparison view
Record the same fields before and after a storefront change:
| Field | Before change | After change |
|---|---|---|
| Shopify-native AOV | Store value | Store value |
| Order count | Store value | Store value |
| Discount amount | Store value | Store value |
| Product mix | Key categories | Key categories |
| Device split | Mobile and desktop | Mobile and desktop |
| Realized adjustments | Refunds and edits | Refunds and edits |
This structure helps distinguish a genuine basket change from a shift in traffic or order volume. If AOV rises while the product mix, discount cost, and conversion behavior remain acceptable, the change deserves further testing. If it rises only because a small group of high-value orders entered the period, extend the observation window before making a permanent decision.
For a broader process for interpreting Shopify reports, see this guide to tracking and understanding Shopify analytics for smarter decisions. The important habit is consistency. Use the same period logic, definitions, segments, and treatment of adjustments each time you review the trend.
Where AOV Falls Short as a Standalone KPI
AOV is a cart and merchandising signal, not a profitability statement. Shopify's native formula excludes taxes, shipping, and post-order adjustments, so multiplying AOV by order count won't necessarily reconcile with GMV. Shopify notes that GMV may include shipping, handling, duties, and taxes in ways the native AOV calculation doesn't capture.
Discounts create another trap. A promotion can increase the number of products in an order while reducing contribution margin. The dashboard may celebrate a larger basket even though the merchant has less money available after product costs, shipping, refunds, and promotion expense.
Two stores can report the same AOV and still have very different economics. One may have stable orders with limited post-purchase changes. The other may experience frequent returns, exchanges, cancellations, or manual edits that reduce the value eventually realized.
Use AOV alongside:
- Adjusted realized order value: Includes relevant post-purchase changes.
- Contribution margin: Shows whether the order creates acceptable economic value.
- Conversion rate: Reveals whether the offer harms completed purchases.
- Refund and return activity: Shows whether larger orders persist after checkout.
- Discount cost: Separates genuine product demand from purchased basket size.
AOV tells you what the original basket looked like. It doesn't tell you the whole financial story.
Setting an AOV Target You Can Actually Defend
AOV targets often fail for a simple reason. They start with a round number someone wants to hit, instead of the kind of order your store can realistically create. A stronger target begins with your current Shopify-native AOV, then checks that baseline against the most relevant category, device, market, and customer segments. From there, ask a practical question: which part of the buying journey could change basket size without creating strain elsewhere?
Keep the first test narrow. Choose one primary lever and give it room to work. That could be a complementary bundle on the product page, a cart drawer recommendation, a quantity incentive, or a shipping threshold. If you change several things at once, the result becomes hard to interpret, like trying to explain a sales jump after rearranging pricing, promos, and merchandising on the same day.
Set the measurement rules before launch:
- Set the comparison window: Keep the pre-test and test periods consistent.
- Define the audience: Specify the device, market, channel, or customer group being evaluated.
- Track the native metric: Record Shopify AOV using the same reporting treatment.
- Track the realized result: Add later payments, refunds, edits, shipping, and taxes where relevant to the native figure.
- Separate revenue from cost: Report incremental product revenue apart from discount cost.
- Check cannibalization: Confirm that the offer created additional value rather than replacing a purchase that would have happened anyway.
A useful target describes a healthier order rather than a taller chart. One merchant may want more complementary items at an acceptable discount. Another may care more about protecting fulfillment speed or avoiding bundles that create stock pressure. Margin, inventory, operations, and customer expectations all shape what a defendable AOV gain looks like.
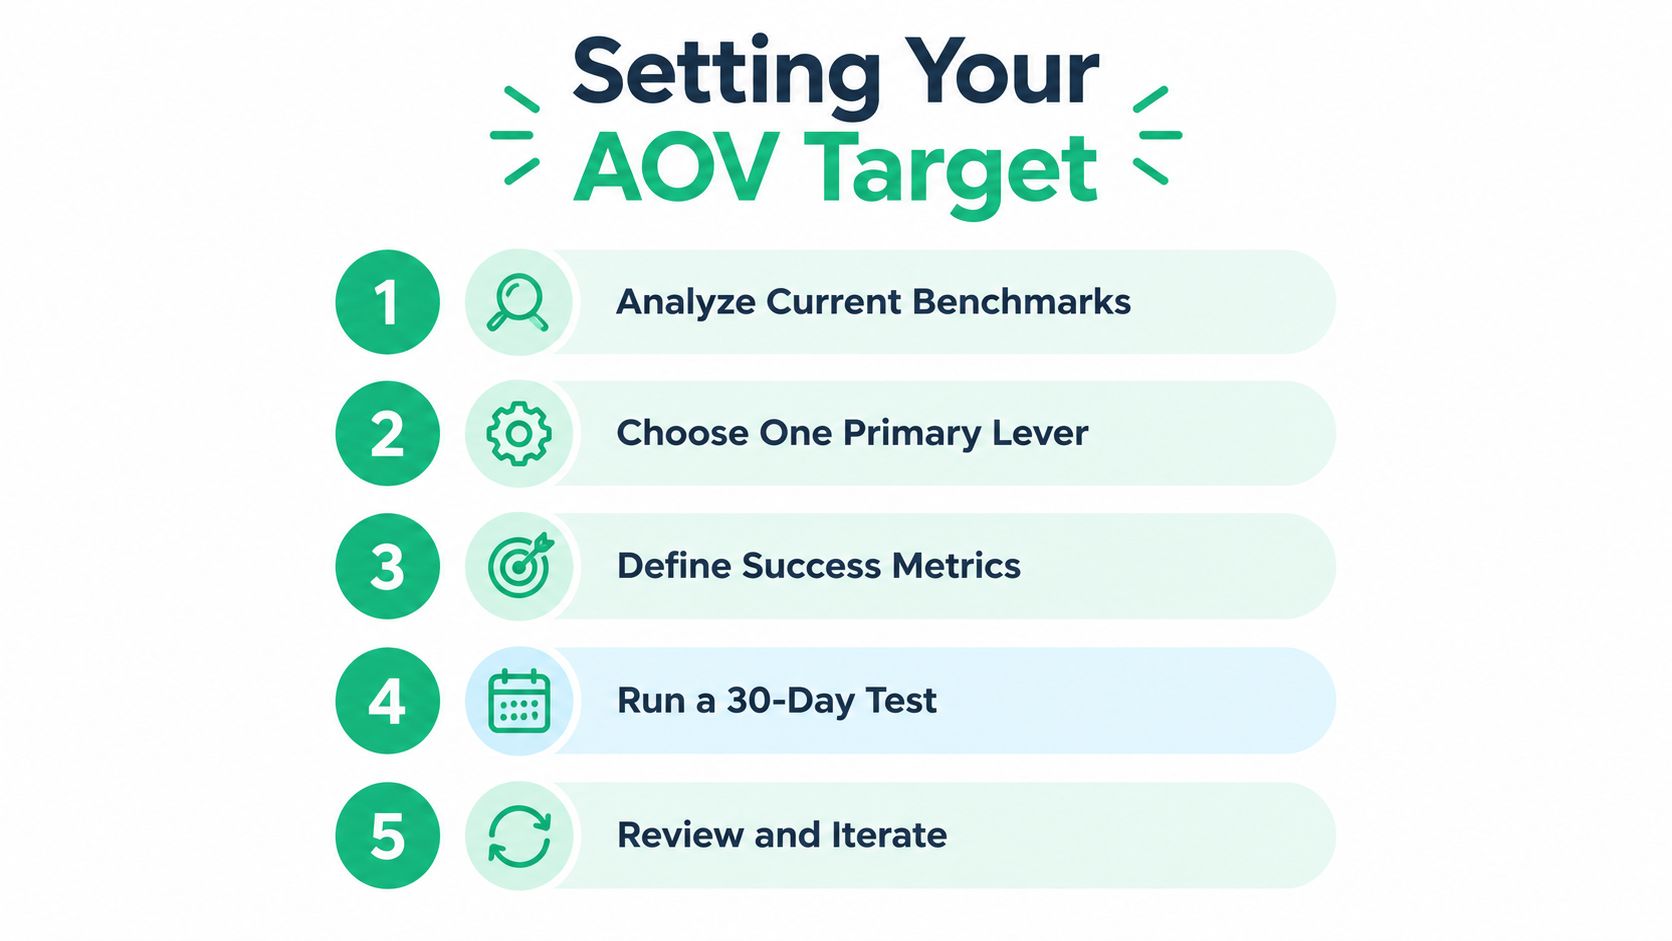
Use a simple decision rule once the test ends. Keep the change when order value improves and conversion, discount cost, refunds, and operations stay within an acceptable range. Tweak it when the offer fits the shopper but appears at the wrong moment or costs too much. Roll it back when higher AOV hides weaker realized economics.
For practical offer design, review these product bundling pricing examples. Then document what happened so the next target starts from evidence, not guesswork.
Product Recommendations Shopify: Best Practices 2026
Learn how to set up and optimize product recommendations Shopify in 2026. Increase average order value and drive more sales with proven strategies.
Read more →
Free Shipping Bar Shopify: How to Set One Up That Works
Free Shipping Bar Shopify. Learn how to set up a free shipping bar in Shopify that converts. Covers thresholds, messaging, placement, and currency tips
Read more →
10 Ecommerce Merchandising Tools for Shopify
Compare 10 ecommerce merchandising tools for Shopify, covering search, personalization, bundles, upsells, cart experiences, and implementation trade-offs.
Read more →