
A 2024 Bluecore benchmark, drawn from more than 100 retailers, put the average ecommerce repeat purchase rate at 16.5%. That figure, reported in Bluecore's customer growth benchmarks as summarized by Joy, is the uncomfortable starting point. A large share of customers who buy once never buy again, and one blended percentage is a poor target for a coffee brand and a sofa brand at the same time.
The useful question is narrower. Inside a window you chose on purpose, what share of a fair cohort placed a second order that improved margin?
Table of Contents
- What Repeat Purchase Rate Actually Counts
- How to Calculate a Fair Cohort Rate
- Repeat Purchase Rate Benchmarks by Category
- Second Orders That Inflate the Rate
- Tactics That Create the Next Order
- Three Stores and Three Honest Rates
- Set the Window Before You Chase a Higher Rate
What Repeat Purchase Rate Actually Counts
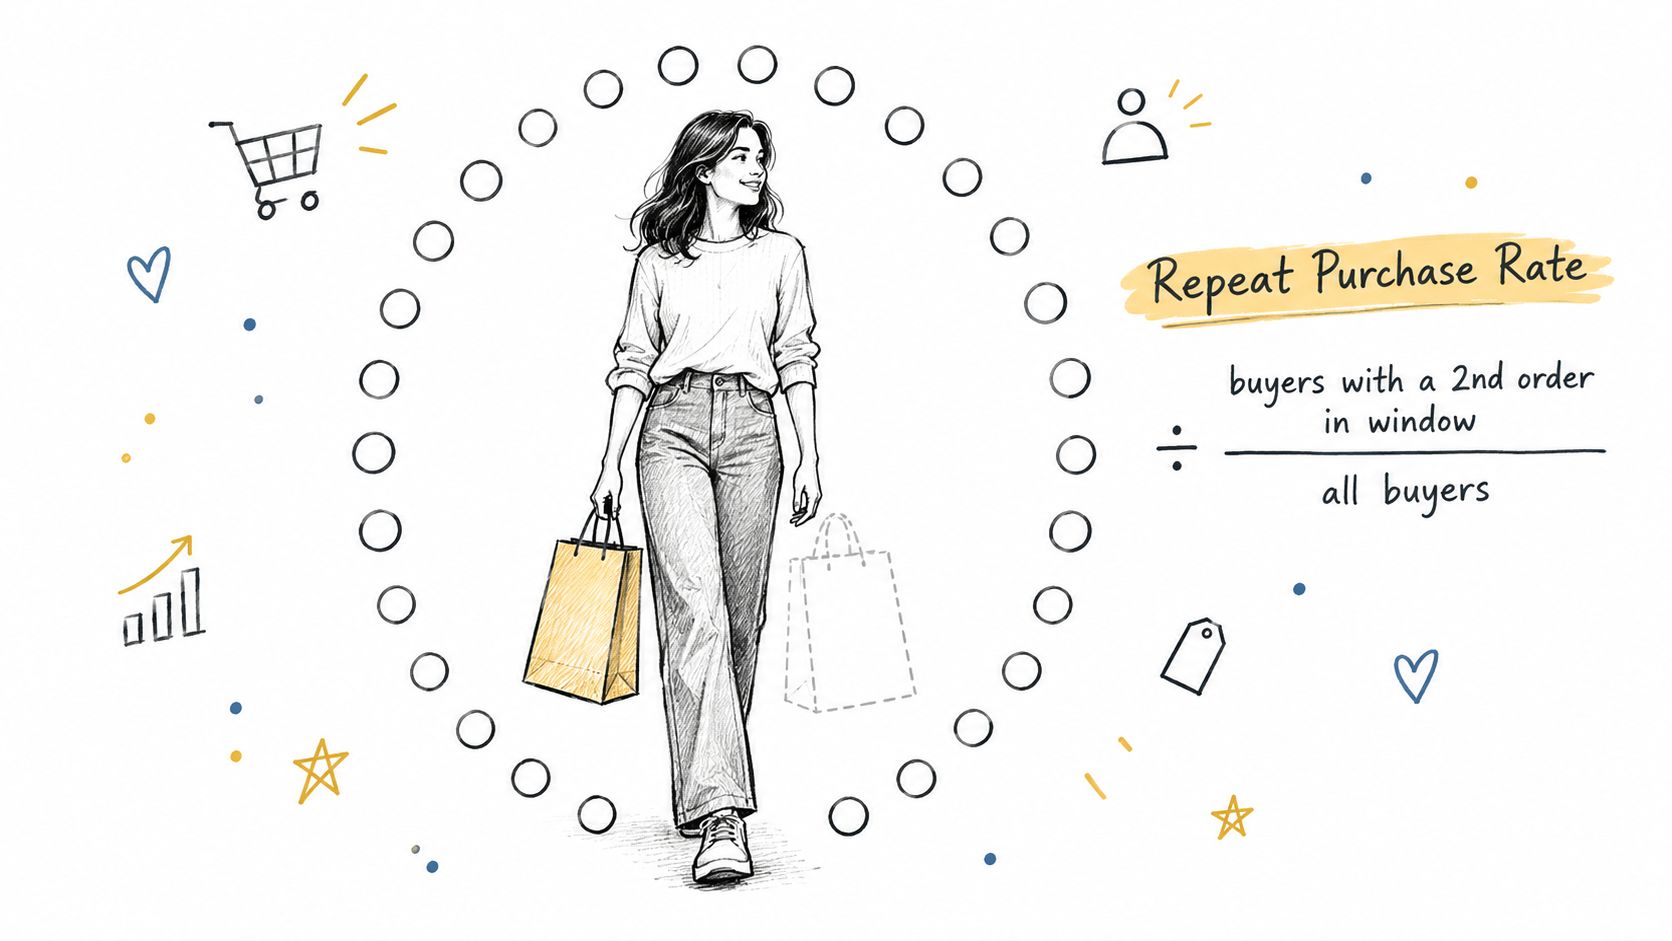
Most customers don't become repeat buyers on their own. Repeat purchase rate is the percentage of customers who place at least one additional order inside a fixed window, divided by every customer in that window, times 100.
A pantry item and a sofa shouldn't share a target. Coffee, vitamins, and pet food run out. The second order is often a restock. A sofa, a laptop, or a piece of jewelry can sit for years. Calling both stores "behind" because they miss the same blended number confuses a short replenishment cycle with a long one.
The money case is older than modern ecommerce. Bain & Company research associated with Frederick Reichheld reported that raising customer-retention rates by 5 percentage points could increase profits by 25% to 95%, because a retained customer can buy again without the full cost of a new acquisition. In apparel e-tailing, the same material reported that repeat customers spent more than twice as much in months 24–30 as in their first six months. Those ranges are foundational retention research, not a promise for every Shopify store, category, or market.
What the percentage is not
Keep three neighboring metrics out of this definition.
- Repeat revenue is dollars from returning buyers, not a headcount share.
- Purchase frequency is how often someone orders, not whether they ordered twice.
- Retention rate asks who is still active, which can include people who haven't bought again yet.
A second order can preserve a sale that would have been canceled, cut a support loop, or add a relevant item. It can also be a duplicate, a replacement, or a discount that erases margin. Match the window to how often the product is naturally bought before you call any rate good or bad.
How to Calculate a Fair Cohort Rate
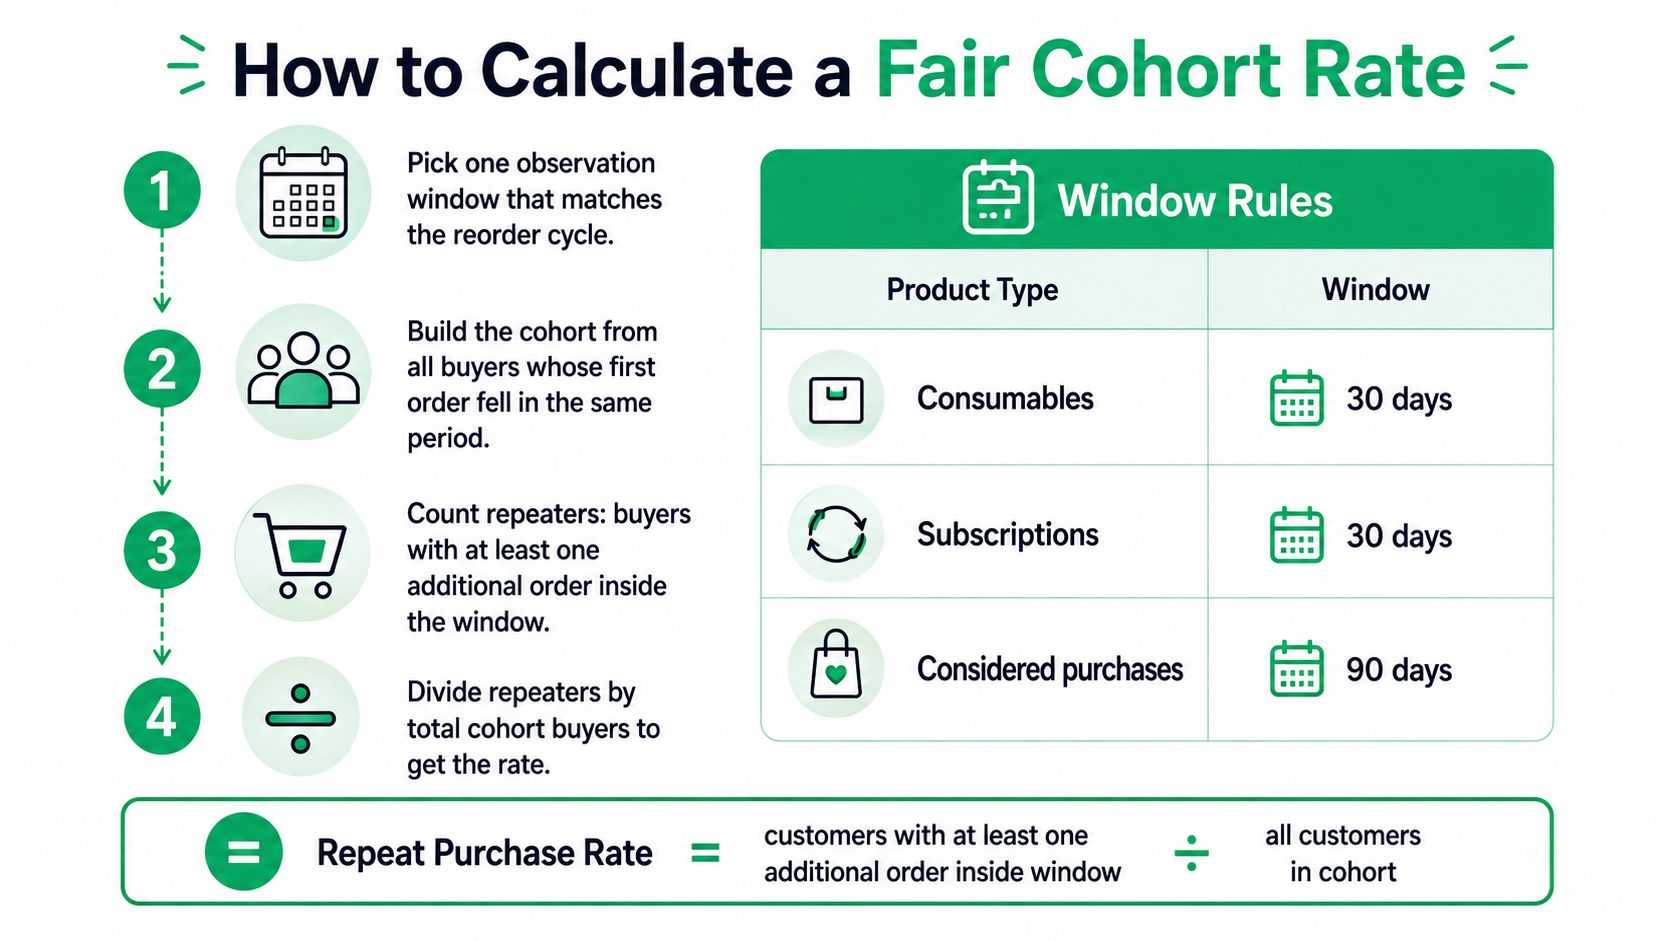
A storewide average mixes people who bought yesterday with people who have had a year to come back. The newer group hasn't had the same chance, so it pulls the rate down even when nothing is wrong. Shopify's ecommerce retention guidance treats the metric as a defined-window or cohort figure: customers with at least two orders in the window, divided by total customers in that window, times 100. Group by first-order month, then measure who reaches a second purchase in a fixed interval such as 30, 90, or 365 days.
Published guidance places broad ecommerce rates around 15–30%, and that range is useful only when category and measurement window match, as Rozee Digital's repeat purchase rate guide notes. The same Shopify analysis of more than 156,000 direct-to-consumer customers found an aggregate rate of 18.8%. Roughly four in five didn't place a second order in the measured period.
Six steps that keep the cohort honest
- Pick one observation window that matches the reorder cycle. Use 30 or 90 days for consumables and subscriptions, and 365 days for apparel, home, and durables.
- Group buyers by first-order month. Never average a 30-day-old cohort with a 12-month-old one.
- Count customers with at least two qualifying orders inside that window. Hold the exclusions in the next section until this step.
- Divide by every customer whose first order falls in the cohort, then multiply by 100.
- Report 30-, 60-, 90-, and 180-day rates as a time-to-second-order curve. Add first-order discount, acquisition channel, and whether the order was seasonal.
- Hold channel, category, discounting, and window constant before you claim a tactic worked. Compare exposed customers with a non-exposed group on the same terms.
Say a month brings 1,000 first-time buyers and 188 of them order again inside the window. That is 18.8%. Guest checkout has to resolve to one identity, or the denominator splits one person into two and the rate looks worse than the behavior.
| Window | Best fit | Bias if misused |
|---|---|---|
| 30 days | Consumables and subscriptions | Durables look like failures |
| 60–90 days | Beauty, supplements, fast apparel replenishment | Seasonal goods look weak |
| 180 days | Seasonal apparel and outdoor | Misses a full year of durables |
| 365 days | Home, furniture, electronics | New cohorts drag a blended average down |
| First-order-month cohort | Every store | Needs enough orders to be stable |
Practical rule: Give every customer in the cohort the same number of days before you decide they failed to repeat.
Cohort math is also the spine of broader ecommerce customer retention work. Before step 3, strip the orders that inflate the count.
Repeat Purchase Rate Benchmarks by Category
Find your row before you read the commentary. A category rate is a baseline, not a grade.
| Category or sample | Repeat purchase rate | Horizon | How to read it |
|---|---|---|---|
| Blended retail, 100+ retailers | 16.5% | 2023, reported 2024 | Directional baseline only |
| Health and beauty | 21.5% | Same Bluecore set | Replenishment lifts the rate |
| Sporting goods and outdoor | 21.2% | Same Bluecore set | Compare inside the category |
| Apparel | 20.2% | Same Bluecore set | Seasonal and discount repeats can inflate it |
| Direct-to-consumer sample, 156,000+ customers | 18.8% | Measured analysis window | About four in five did not reorder |
| Pet, supplements, household, subscriptions | 25%–40% | About 12 months | Short windows are fair |
| Furniture, electronics, jewelry, luxury | Below 10% | About 12 months | A low rate can still be healthy |
How to read the bands
A 2024 Bluecore benchmark covering more than 100 retailers reported that 16.5% blended average, then split it. Health and beauty reached 21.5%, sporting goods and outdoor products 21.2%, and apparel 20.2%. Define the rate precisely, for example as customers placing at least one additional order within 12 months, because a different window or cohort produces a different result.
Consumables create a natural second order. The jar empties. Durables don't. A furniture buyer who returns once in a year, at a high contribution margin, can be healthier than a supplement buyer whose second order only exists because of a sitewide code.
A holiday spike does the same trick in reverse. Aggregate purchase frequency can rise because replenishment got shorter, or because a promotion pulled demand forward. The blended number goes up. Loyalty didn't have to.
A lower headline rate can be the healthier business if each repeat order carries more margin and more contribution profit.
Choose the row that matches both your category and a 12-month horizon. Then build the cohort. Don't chase 16.5%.
Second Orders That Inflate the Rate
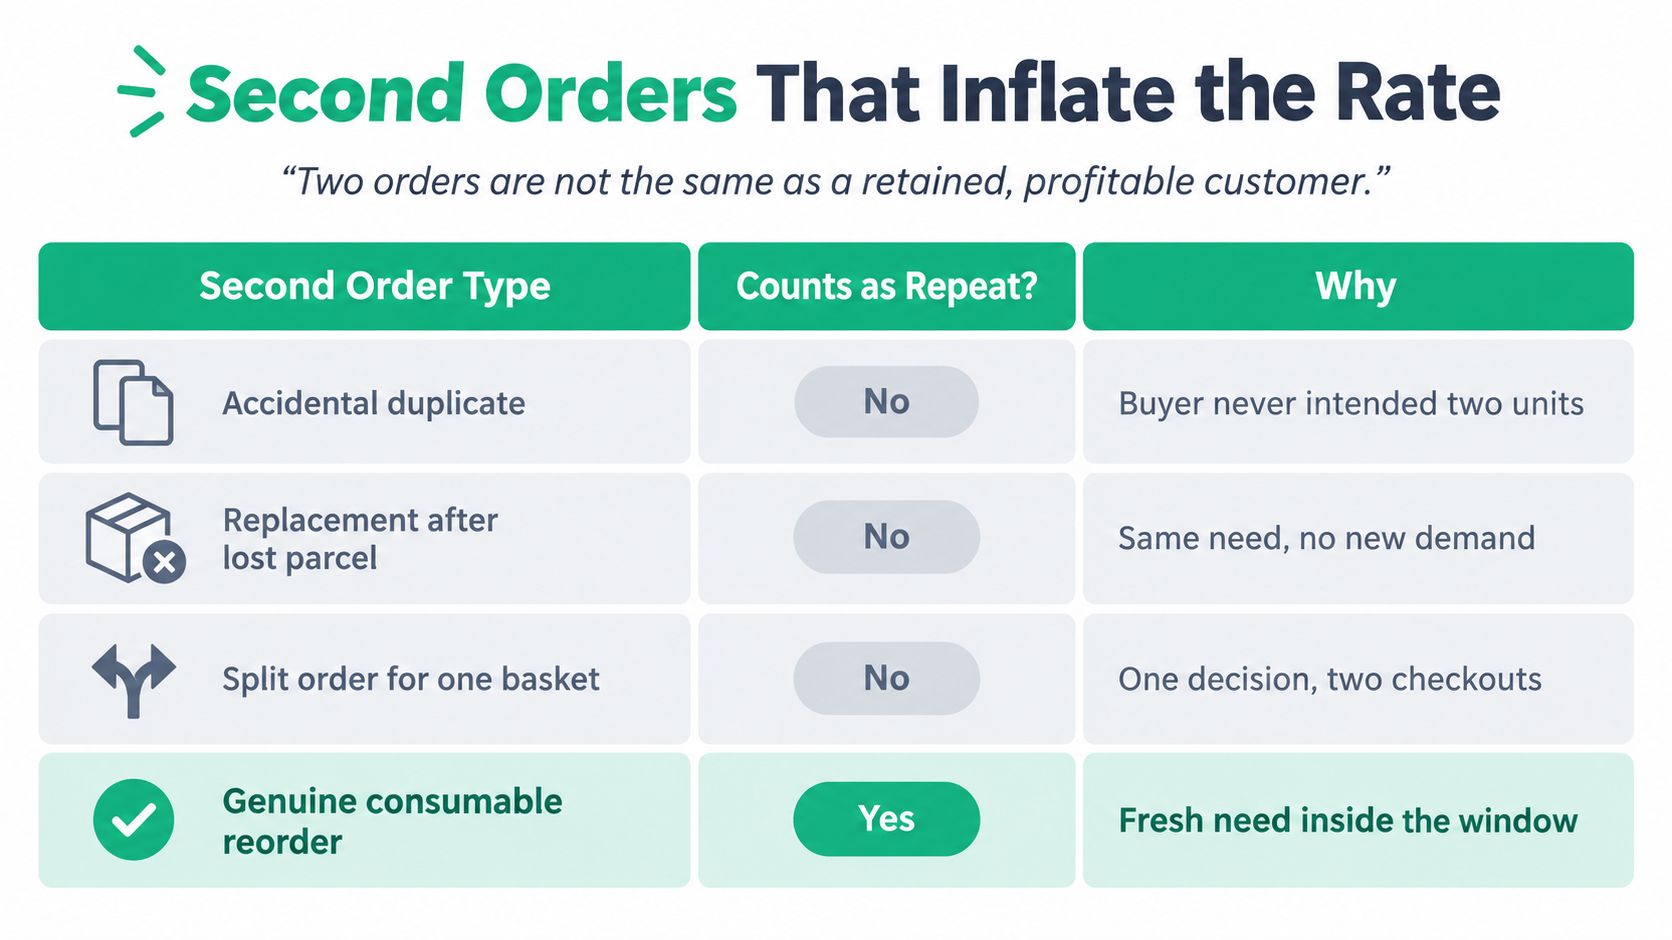
Two orders are not the same as a retained, profitable customer.
A repeat-purchase rate counts customers with another order, but order records can misrepresent renewed demand. Accidental duplicates, replacement shipments, and some refund-driven reorders may raise the rate without showing that a customer chose to buy again. Ecommerce analytics guidance highlights the need to define what the metric includes. Exclude duplicates and replacements, resolve guest identities consistently, and separate repeat-buyer revenue from new-buyer revenue during seasonal periods.
| Event | Counts as a healthy repeat | Check instead |
|---|---|---|
| Accidental duplicate order | No | Same items minutes apart |
| Replacement for a lost or damaged parcel | No | Support or fulfillment tag |
| Reorder after a refund | Only if it reflects new demand | Refund reason and margin |
| Deep-discount second basket | Only if contribution stays positive | Discount depth and gross margin |
| Low-margin add-on only | Rarely | Contribution after incentives |
| Size, color, or address edit on the original order | No | It preserves order one |
The dashboard next to the rate
Pair the percentage with measures that show whether repeat orders create value:
- Second-order gross margin: profit on the basket before treating the count as a win.
- Discount depth: how much of the purchase depended on a promotion.
- Return rate and cancellation rate: whether demand held or the order was later reversed.
- Support contacts per order: friction that may affect the customer's willingness to return.
- Contribution profit and days to the next order: whether the purchase paid for itself, and how long it took.
A size or address change preserves the original order; it does not belong in the repeat-purchase numerator. For subscriptions, separate a completed renewal from an order record that only appears to be one. Use subscription business model metrics to assess retained demand and margin alongside renewal counts.
Device experience, country, acquisition source, and product family can all shape observed repeat rates. Break out those groups before treating a blended percentage as a target.
A lower clean rate can be healthier when repeat orders contribute more profit. Measure the rate and the margin together.
Tactics That Create the Next Order
CartBoss's category benchmarks put pet products, supplements, household consumables, and subscription goods around 25%–40% over 12 months. Apparel, beauty, footwear, and home goods commonly fall around 15%–25%. Furniture, electronics, jewelry, and luxury gifting can fall below 10%. Judge a post-purchase change against that matched baseline, not against a universal target.
Fix the first order before you hunt the second
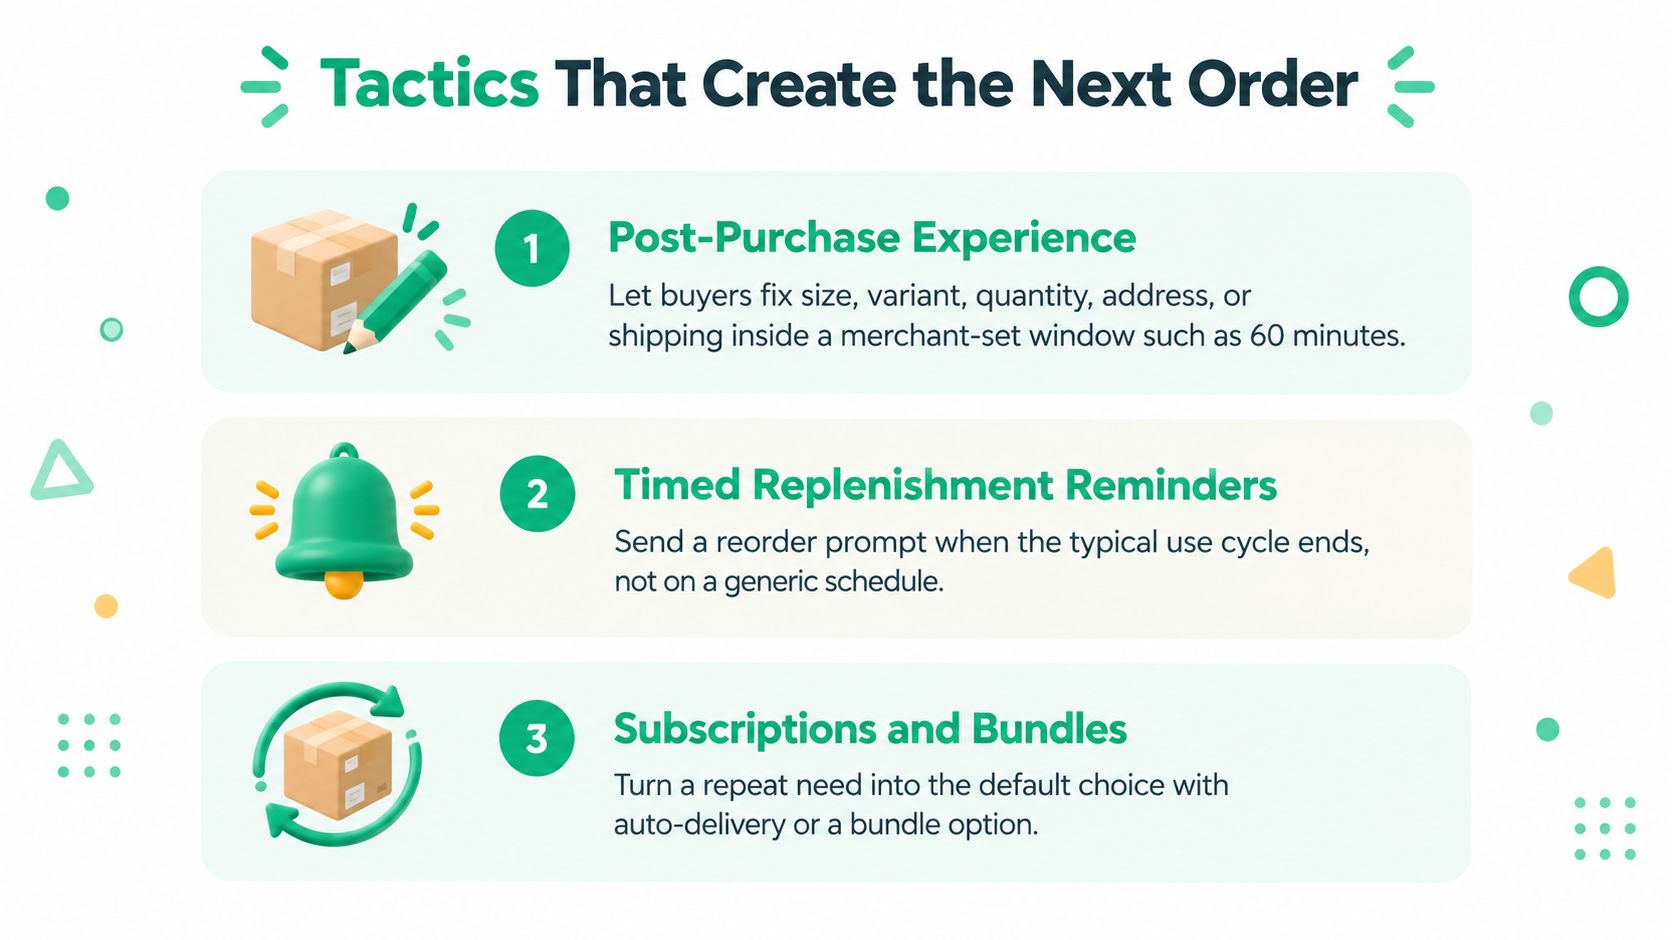
If the buyer can't correct size, variant, quantity, address, or shipping, the first order becomes a cancellation. There is no second purchase to measure. Open a merchant-set window, such as 60 minutes or a few days, and let the edit happen inside rules you already trust. Score this lever on cancellation rate and support contacts per order. Don't book the edit as a repeat.
Time the reminder to the product that actually runs out
Offer a selling plan on the variant that is consumed. Vitamins often want a prompt near 30 days. Seasonal apparel wants the next season, not a monthly charge. Don't subscribe a durable the customer won't need again. One replenishment message, one useful-content message, and one offer is enough. Cap the offer so discount depth can't fake the metric, and suppress anyone who already reordered.
Ways to increase repeat purchases without discounting matter here, because a code that buys the second order can also buy a worse contribution line.
Cart merchandising sits earlier. A spend-tier reward can deepen basket one, and a fuller first basket often marks who comes back. It still isn't the repeat rate. If you want the longer view of how to improve customer lifetime value with data, Data Hunters Agency walks through the value math that a single reorder percentage leaves out.
Score every test on five outcomes together: incremental second-order rate, time to second order, gross margin after incentives, cancellations, and contacts per order.
A tactic fails when the rate rises and contribution falls.
Three Stores and Three Honest Rates
Same base, three windows. Each story starts with 1,000 first-time buyers so the math stays comparable. The brand isn't what changes the verdict. The window and the exclusions are.
Supplements, 90 days. 320 customers reorder. The rate is 32%, inside the consumable band. That looks strong until you open the subscribe-and-save discount. If contribution after that discount is negative, the rate is a costume. The wrong move is a victory slide while margin is underwater.
Apparel, 365 days. 190 customers reorder, or 19%, near a typical apparel read. Forty of those orders were exchange-driven replacements. Strip them and the clean rate is 15% (150 of 1,000). The action is fewer size failures, not a bigger welcome code. The wrong move is blending the replacements back in so the dashboard looks closer to the category line.
Furniture, 365 days. 70 customers reorder, or 7%, which sits in the durable band. Those 70 spend far more per order than a replenishment buyer. Protect delivery and care content. Don't force a subscription on a table. The wrong move is shortening the window to 30 days, then telling the team the store "lost" repeat demand it was never going to see that month.
The percentage moved because the clock and the exclusions moved, not because one brand was more loyal.
Copy three lines for your own first-order month. Window. Raw second orders, then clean second orders. Contribution after incentives. If you can't fill the third line, you don't have a rate worth managing yet.
Set the Window Before You Chase a Higher Rate
This week, finish five decisions on one first-order cohort. Don't publish a number until they are done.
- Lock the window you already chose. Use 30 or 90 days for consumables and subscriptions, and 365 days for apparel, home, and durables.
- Drop accidental duplicates and replacement shipments. Resolve guest checkout to one identity before anyone sees the percentage.
- Put second-order contribution profit beside the rate. Keep the lower clean figure when a deep discount or a low-margin add-on is doing the lifting.
- If first orders die in support, open a controlled edit for size, variant, quantity, and address inside a window such as 60 minutes or a few days. Merchants who use order editing and cancellations together see cancellation rates drop by 30–40%. Judge the edit by cancellation rate and contacts per order, not by calling it a repeat. Each order change F3 Gear Store handled through self-service saved 10–15 minutes of support time.
- Only after those checks, send one replenishment message or offer a selling plan on items that are consumed. Suppress anyone who already reordered.
On Shopify, SelfServe can hold that status-page edit, and CartServe or UpServe can run a later basket test. Top Nutrition reports a 12.4x ROI and 82 self-service edits with SelfServe. Those dollars stay incremental revenue until the next cohort shows a higher clean second-order rate.
Publish the cohort rate only after the window, the exclusions, and the margin check are in place.
ServeApps builds Shopify apps for the work around a second order: self-service edits that keep the first order alive, cart rewards that deepen the basket, and contextual upsells tied to what the customer already bought. If you want that post-purchase path on the order status page and in the cart, visit ServeApps and see which app fits the window you're measuring.
Shopify Store Credits: Issuing, Redeeming and Accounting
Learn what Shopify store credits are, how they differ from gift cards and refunds, and how to issue, redeem and account for them.
Read more →
Can You Have Multiple Stores on Shopify? Plans and Limits
Can you have multiple stores on Shopify? Yes, through organizations or Plus expansion stores. Compare plan limits, eligibility and setup tips.
Read more →
Product Customizer App Shopify: Choosing the Right Tool
Compare native and third-party product customizer app shopify options on speed, theme support, variant mapping and SKUs before you install one.
Read more →