
In 2023, U.S. retailers experienced $743 billion in merchandise returns, equal to 14.5% of total retail sales, according to the National Retail Federation and Appriss Retail report on 2023 returns. That scale changes how you should manage returns in ecommerce. A return isn't a refund plus a support ticket. It's cash out the door, stock in transit, and warehouse time spent deciding whether that stock can earn again. Judge each policy and process change by margin recovered and repeat purchase, not by return rate alone.
Table of Contents
- Ecommerce Return Rate Benchmarks for 2026
- How a Return Moves Through Your Operation
- What One Return Really Costs Your Margin
- Return Policy Choices That Change Buyer Behavior
- Cutting Return Volume Before the Package Ships
- Routing Returned Items to Their Best Outcome
- Three Store Types and Their Different Return Problems
- Start With a Return Reason Audit
Ecommerce Return Rate Benchmarks for 2026
In 2023, 17.6% of online merchandise purchased in the United States was returned, representing approximately $247 billion, according to the National Retail Federation and Appriss Retail 2023 consumer returns report. Across all U.S. retail, returns reached 14.5% of sales, or $743 billion. Those figures establish the scale of the issue, but neither is a target for an individual store.
Online shoppers cannot touch fabric, check weight, or test fit before paying. They make choices from photos and measurements, and may order multiple sizes to decide at home. In a physical store, shoppers can compare items before purchasing. The different rates reflect distinct shopping experiences, but they do not explain why an individual product is returned.
Return Rate Benchmarks by Channel and Year
| Benchmark | Scope | Year | Rate or value |
|---|---|---|---|
| Overall U.S. retail returns | All retail sales | 2023 | 14.5% ($743 billion) |
| Online purchases returned | U.S. online merchandise | 2023 | 17.6% ($247 billion) |
| Expected annual returns | Large U.S. retailers (over $500M revenue) | 2024 | 16.9% of annual sales (about $890 billion) |
| Holiday return surge | Large U.S. retailers | 2024 | 17% above annual average |
| Total U.S. retail returns projected | All retail sales | 2025 | 15.8% ($849.9 billion) |
The figures show that returns represent a substantial share of retail sales, with online merchandise at a higher rate than retail overall in 2023. That difference is useful context, not proof that channel mix caused the change in the all-retail rate. A shift from stores to online may change a merchant's return exposure, but the effect depends on its products, customers, and sales mix.
The large-retailer figures are most useful for thinking about operating capacity. The 2024 estimate and holiday surge indicate that return volumes can vary over the year for large retailers. Receiving, inspection, refund approval, and restocking may remain busy after sales peak. Store-specific forecasts should guide staffing and working capital decisions, rather than assuming a large retailer's pattern will transfer directly.
How to Use These Numbers in Your Store
These benchmarks are U.S. focused, enterprise weighted, and blended across categories. Apparel, electronics, and cosmetics have different return patterns, and a smaller Shopify store has a different customer mix from a national chain. Use the table to understand scale, not to set a target rate or predict your cash tied up in returns.
Calculate your rate consistently each month using returned units divided by units shipped in the same 90-day period. Then split the result by product type and channel. Units reveal more than orders when one order can contain several items, and a storewide average can hide the product driving avoidable returns.
A rate well above similar products in your own catalog usually points to product content or fit before it points to policy.
Investigate the product before tightening rules for every customer. If one jacket returns at twice the rate of the rest of your outerwear, examine what its product page fails to explain. A lower return rate is useful only if the change also protects margin and repeat purchase.
How a Return Moves Through Your Operation
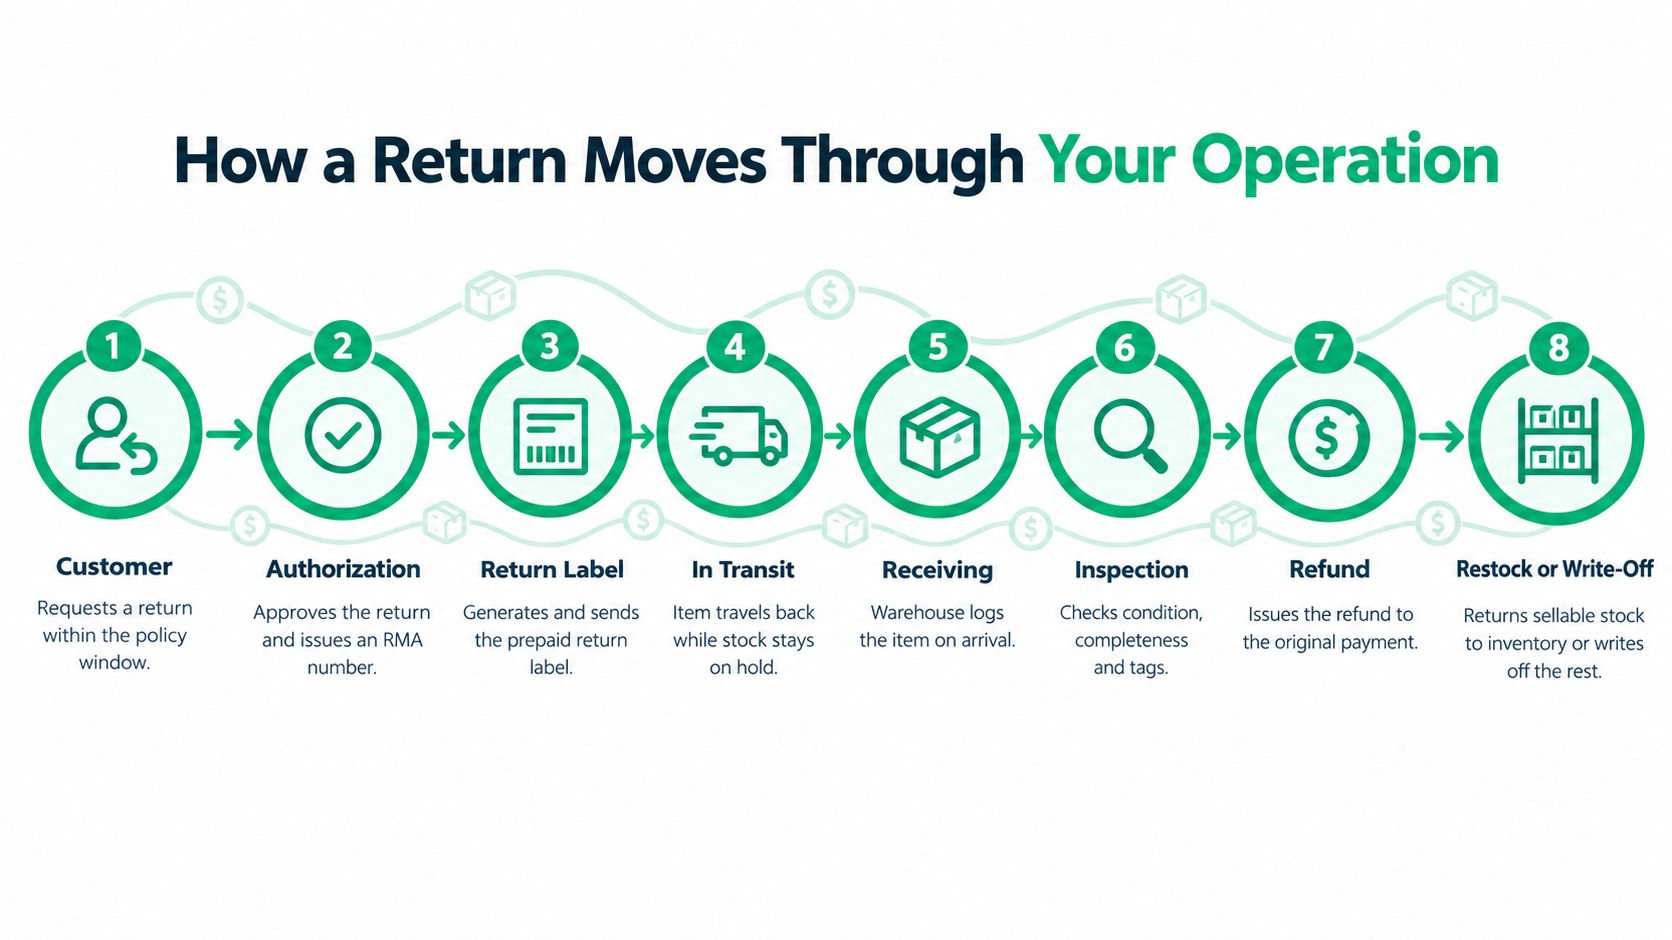
A return is a sale played in reverse, except nobody designed the reverse path as carefully. Money leaves, stock travels, and both stay stuck until someone grades the item and puts it back into a sellable state or writes it off. The eight stages below show where that value sits, and where it leaks.
The diagram maps the full path from request to restock.
The Eight Stages
- Customer requests a return. They pick a reason code, such as wrong size, damaged, or not as described. This stage produces the data that makes every later improvement possible, so keep codes specific and mandatory. A free text box alone gives you anecdotes, not patterns.
- Policy check confirms eligibility. Your system checks the window, item condition rules, and exclusions. Automate this check against the order date and product tags. Manual approval of routine cases burns support time and delays the parcel.
- Label or drop-off option is issued. The customer gets a prepaid label, a QR code, or a locker location. Label cost is set here, so the cheapest convenient route wins. Consolidated drop-off points can cut per parcel cost compared with individual home pickups.
- Carrier moves the parcel, warehouse receives it. Stock is neither sellable nor refunded during transit. Scan on arrival the same day. An unscanned pile in a corner is invisible inventory, and customers start asking where their refund is.
- Staff inspect and grade the item. They check seals, tags, completeness, wear, and function. This stage decides recovery value, so graders need clear standards with photo examples. Ungraded items restocked as new create the next return, plus a worse review.
- Disposition is chosen. The item goes to restock, open-box resale, refurbishment, liquidation, or write-off. Decide at the grading bench, not in a weekly meeting. Every day an item waits, its resale window shrinks, especially for seasonal goods.
- Refund or exchange is issued. Refunding before the parcel arrives is fast and generous, and it invites empty box fraud. Tie the refund trigger to a carrier scan or warehouse receipt for higher value orders, and say so clearly at request time.
- Inventory and reports are reconciled. Restocked units go back into available counts, write-offs leave them, and the reason code lands in reporting. Restocks that skip scanning make your counts drift, and then you oversell stock you don't have.
Where the Money Leaks
Stages 5 and 6 decide how much value you recover. Stage 1 decides whether you'll ever know why items come back. Most stores invest in stage 7 speed because customers notice refunds, then underinvest in grading because customers never see it.
Map your own flow this week. Write down how many days each stage takes, from request to reconciled inventory. The slowest stage sets how long your cash and stock stay tied up, and it's rarely the carrier. It's usually the unopened pile at receiving or the disposition decision nobody owns.
What One Return Really Costs Your Margin
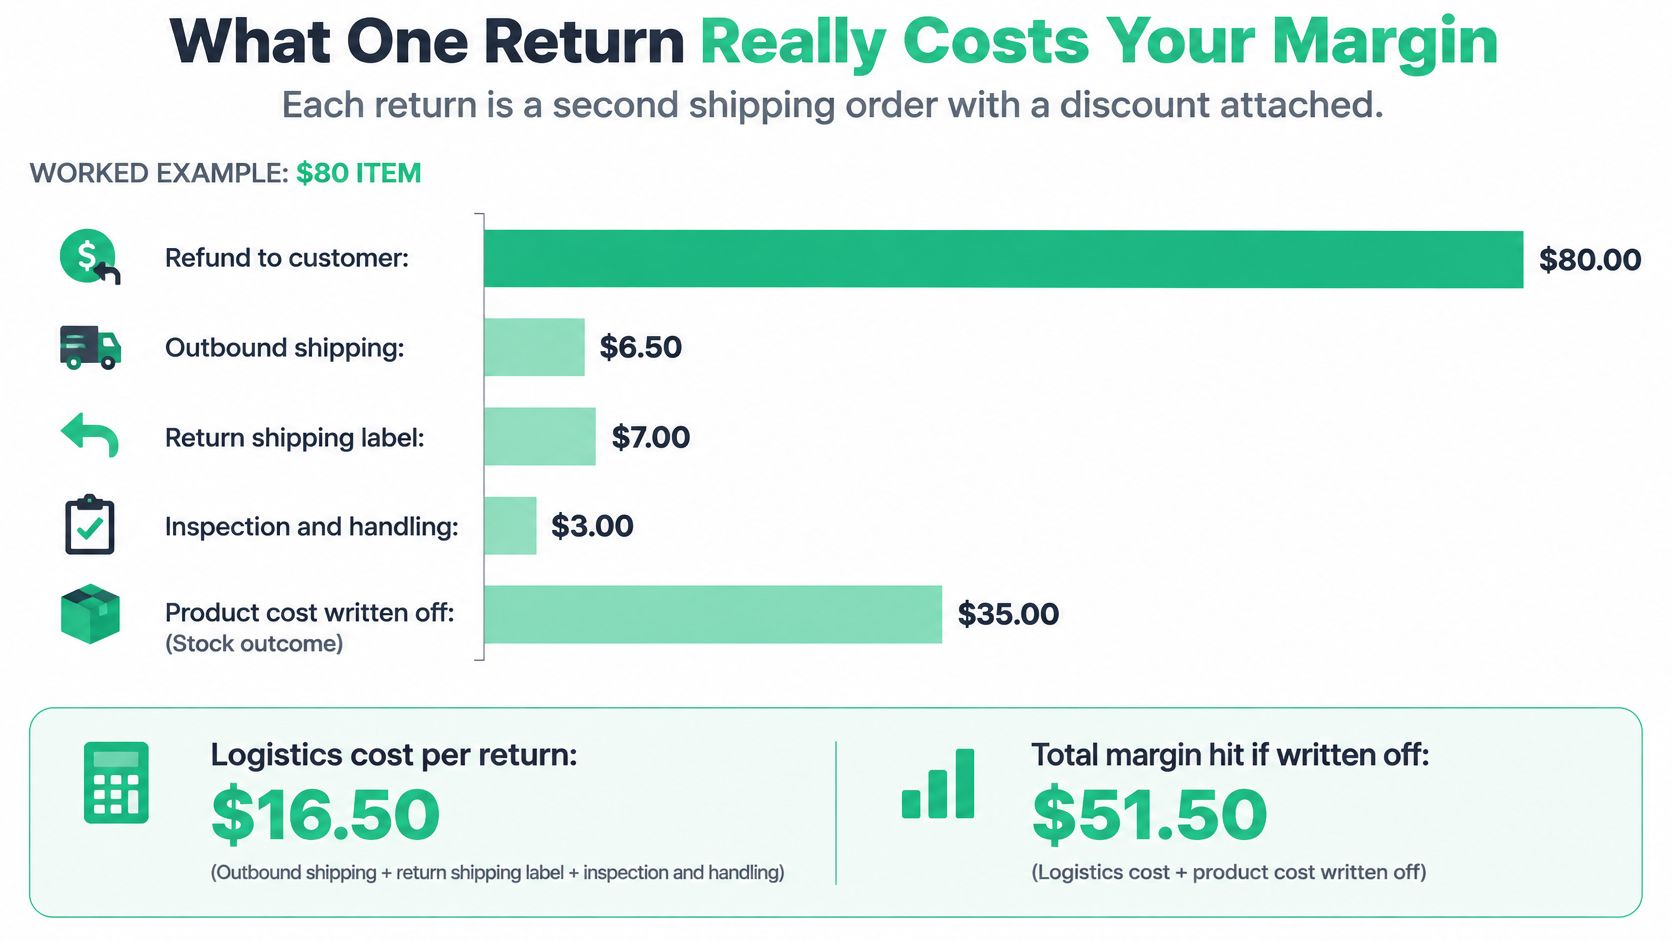
Say you sell an $80 item with $40 of cost of goods. The customer returns it. The $80 refund isn't your cost, because that revenue was never really earned. Your cost is the logistics you can't recover plus whatever happens to the stock. That's why two stores with identical return rates can lose very different amounts of money.
The chart breaks one return into its moving parts.
Illustrative Cost of One $80 Return by Resale Outcome
| Cost component | Restocked at full price | Resold at 70% | Written off |
|---|---|---|---|
| Outbound shipping absorbed | $6 | $6 | $6 |
| Return shipping label | $8 | $8 | $8 |
| Inspection and restock labor | $3 | $3 | $3 |
| Markdown on resale | $0 | $24 | $0 |
| Cost of goods written off | $0 | $0 | $40 |
| Total cost of one return | $17 | $41 | $57 |
The first three rows don't move. Whether the item comes back pristine or ruined, you've paid $17 to ship it out, ship it back, and handle it. Think of each return as a second shipping order with a discount attached. The stock outcome then decides whether that $17 is the whole story or just the opening charge.
Resale at 70% of an $80 price means a $24 markdown, which more than doubles the total cost to $41. A write-off destroys the full $40 of product cost and takes the total to $57. Speed matters here in a way refund speed doesn't. An item graded and repriced within days has a real chance at the $17 or $41 outcome. The same item sitting ungraded for a month drifts toward write-off as seasons turn and packaging gets damaged.
The question to ask: not how many returns you processed, but how many landed in each cost column.
Scaling the Example to a Real Store
Small per return costs become large at volume. Large U.S. retailers expected 16.9% of annual sales to be returned in the 2024 NRF and Happy Returns returns report. Apply that rate as an illustration to a merchant with 100,000 annual orders and you get about 16,900 returns before holiday concentration. At even the cheapest outcome in the table, that's a six figure logistics bill. At a blend of outcomes, it can exceed the profit on thousands of successful orders.
Peaks make it worse. Holiday returns were expected to run 17% above the annual average in that same benchmark, so receiving benches and refund capacity sized for average volume will backlog exactly when returned stock is most time sensitive. A January backlog isn't just slow service. It's holiday merchandise losing resale value by the week.
The example also leaves things out, and you shouldn't. Payment processing fees on the original sale usually aren't returned to you when you refund. Support contacts about return status cost staff time. A customer who has a bad return experience and never buys again costs future margin that's real but hard to price, so track repeat purchase after a return rather than guessing.
Run your own version now. Take your top three categories and plug in your actual outbound shipping absorbed, label cost, handling minutes at your labor rate, and average resale percentage. You'll likely find one category where preventing a return is worth three times more than in the others. That's where your effort belongs.
Return Policy Choices That Change Buyer Behavior
Return policies shape three outcomes at once: whether a shopper buys, whether a customer sends an item back, and how soon returned stock can be resold. A 2025 study of Walmart return policies and customer reviews found that monetary, effort, and product-scope leniency influenced both return propensity and satisfaction, while return-window length affected satisfaction but not whether customers returned products. The finding cautions against treating a longer window as a direct way to reduce returns. It may improve how customers feel about the policy, but the study did not find that it changed whether they returned products.
A longer window still has an operational cost: it can delay restocking and resale, leaving more time for returned items to lose value or require markdowns. Set the window with customer satisfaction and stock timing in mind. If your goal is to reduce return volume, consider other policy levers as well.
Stricter conditions can deter some shoppers, and fees are a common source of frustration. A fee may save money on an individual return while putting the original sale at risk. Judge that trade-off by the margin and repeat purchases it affects, not by the return rate alone.
Policy Levers and What Each Does to Returns
| Lever | Common setting | Effect on returns | Trade-off |
|---|---|---|---|
| Return window | 30 to 90 days | Length affected satisfaction but not whether customers returned items in the Walmart study | Longer windows delay restocking and resale |
| Return shipping | Free, flat fee or customer-paid | Free shipping can increase return propensity and conversion | Label cost rises with each return |
| Restocking fee | 10-20% on opened or high-price items | May deter some marginal returns on expensive goods | Can damage trust if applied to defective items |
| Exchange-first flow | Offer a swap before a refund | Keeps the sale on the same order when a customer chooses an exchange | Adds a step for customers who want money back |
| Store credit bonus | Extra value for store credit over refund | Can shift some customers toward credit | Less liquid for customers, so some will still ask for refunds |
| Final-sale or category exclusion | Excluded items listed clearly before checkout | Prevents returns on items covered by the exclusion | Can put conversion at risk if the exclusion surprises shoppers |
| Repeat-returner limit | Flag accounts above a set return count | Targets repeat behavior without applying the same limit to every buyer | Needs clear rules to avoid false flags |
Reading the Levers Together
The Walmart study also argues against applying one rule to every product. Customers may accept reasonable restrictions, and partial refunds or restocking fees may be acceptable when the original purchase price is high. A fee on an opened premium appliance presents a different trade-off from a fee on a t-shirt. Free returns everywhere can ignore differences in handling cost and resale value, while charging every customer can create unnecessary friction.
Effort matters alongside money. Requiring customers to print labels, find a drop-off point, or wait for approval changes the work involved in returning an item. You can keep returns free in dollars while asking for a reason code, photos for damage claims, or drop-off instead of home pickup. Each requirement should have a clear operational purpose, since added friction can affect satisfaction as well as return behavior.
The lever that matters is the friction a customer feels, not the policy headline.
The process must match the promise on the policy page. A store can advertise free returns while burying the starting link, or charge a flat fee and make the steps easy to find. Clear terms help shoppers understand what they will pay, which items are excluded, and how to begin. For a practical outline, a clear Shopify return policy structure can help you state windows, fees, and exclusions where buyers tend to look.
Test One Lever at a Time
Change one lever in one product category, keeping the other conditions steady. Measure conversion, repeat purchase, margin, and support contacts together over at least one full sales cycle. Calculate margin using your cost per return by outcome, not just the refund value.
A lower return rate is not automatically a win. If conversion falls further because first-time buyers lose confidence, the policy may cost more than it saves. Free return shipping can also increase returns and still be worthwhile if completed purchases rise enough to offset the added cost. Comparing these measures shows whether a policy change improves the business outcome, rather than only changing how many items come back.
Cutting Return Volume Before the Package Ships
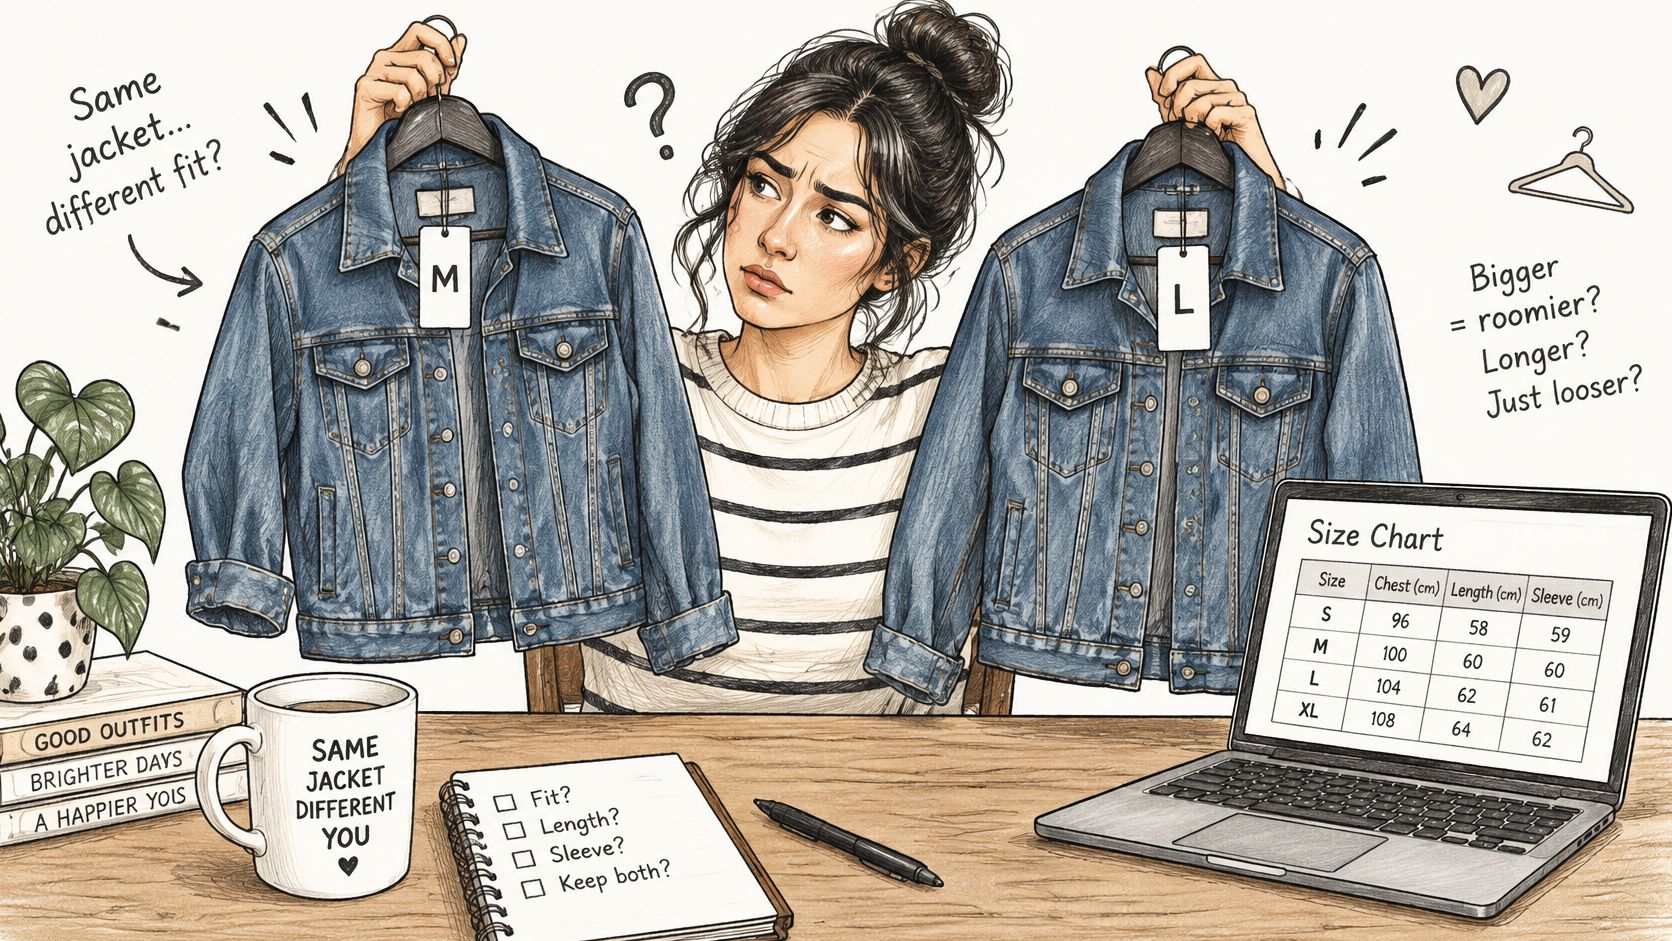
A shopper stares at two sizes of the same jacket. The size chart lists S, M, and L with no garment measurements, the model wears a medium with no height given, and reviews disagree about fit. She orders both. One return is now guaranteed, and your policy had nothing to do with it. The cheapest return in ecommerce is the one your product page prevented.
The sizing problem is visible in the moment of hesitation itself.
The Prevention Levers, in Order of Effort
Product content comes first. Publish measured size charts with actual garment measurements per size, not generic body ranges. Add fit notes written in plain language, such as runs small through the shoulders, and surface reviewer fit votes near the size selector. Show real photos under several lighting conditions so color stops being a surprise, and add a short video of the product in use to show drape, scale, and texture. For a structured approach to building pages that answer these questions before checkout, this guide to Shopify product page optimization covers layout and content priorities in detail.
Apparel merchants who want a deeper treatment of fit data and size recommendation workflows will find useful specifics in ClothME's fit-first returns playbook, which focuses on measurement driven prevention rather than policy tightening. Use it as a complement to your own reason code data, not a substitute. Your customers' stated reasons outrank any general playbook.
Reason-code review comes second. Take your top three return reasons and map each one to the product page field that would have prevented it. "Not as described" usually points to missing dimensions, materials, or compatibility limits. "Arrived damaged" points away from the page entirely, toward packaging. This mapping exercise stops you from fixing photography when the actual problem is a crushed box.
The video below walks through how clearer pre-purchase information changes what customers order in the first place.
Exchange before return comes third. When a customer requests a refund for the wrong size, offer the swap first, in the same flow, with the replacement size preselected. Revenue stays on the same order and the customer gets the product they wanted. A refund ends the relationship at a loss. An exchange costs you shipping and keeps the sale.
Self-service order edits come fourth. Some returns start as mistakes caught minutes after checkout. The customer picked the wrong size or color, notices on the confirmation screen, and faces a support ticket or a return later. Let them change size, color, or address inside a window you set, with inventory, shipping, and order tags updated by the change itself rather than by a manual ticket. The edit prevents a shipment nobody wants, which is cheaper than the fastest returns process you'll ever build.
Pick by Cost, Not by Count
Each lever cuts a different reason. Content fixes expectation gaps, edits fix ordering mistakes, exchanges fix fit misses that still happened. Building all four at once spreads your effort thin and makes results impossible to attribute.
Choose the one return reason that costs you most, using volume multiplied by your cost per return for that category. Fix its prevention step first. A reason that's frequent but cheap can wait behind a rarer reason that ends in write-offs.
Routing Returned Items to Their Best Outcome
U.S. retail returns were projected to reach $849.9 billion, equal to 15.8% of annual retail sales, in 2025, according to the National Retail Federation and Happy Returns 2025 returns projection. For an individual store, that scale is a reminder that approval is only the start of the economics. The next decision is where each item goes, how quickly it gets there, and how much working capital can be recovered.
Disposition Route by Return Condition
| Return condition | Disposition | Recovery value | Control to apply |
|---|---|---|---|
| Unopened, undamaged | Restock to sellable inventory | High | Verify seal and SKU before restock |
| Opened, light wear | Open-box or outlet resale | Medium | Grade and reprice promptly after receipt |
| Damaged or defective | Manufacturer return, refurbishment or liquidation | Low to medium | Confirm the defect reason code with photos |
| Used or hygiene-sensitive (swimwear, cosmetics) | Donate, recycle or destroy per policy and brand agreement | Low | Check local rules and supplier terms before disposal |
| Low-value item where return cost exceeds value | Returnless refund | Low | Set the value threshold in advance and document it |
| Suspected fraud (empty box, wardrobing) | Hold for review under the store's policy | Protected | Flag repeat accounts and keep the evidence |
Start with the value at stake. Unopened stock can return to full-price inventory, but only if someone verifies the seal and SKU before restocking. That quick check helps prevent a returned product from being shipped to another customer as new. Opened items with light wear may still recover value through an open-box or outlet listing. Their condition needs grading and repricing promptly, while the product is still relevant to shoppers and before older stock competes with deeper discounts.
Damaged and defective items need evidence before they are routed. Photos tied to the defect reason help distinguish a manufacturer issue from customer damage, which may call for a different disposition. Hygiene-sensitive goods often have limited resale options. Set the donation, recycling, or disposal route with supplier terms and local rules in mind before those cases arrive. Managing the steps from receipt through disposition is part of reverse logistics management for ecommerce returns. Written routes reduce reliance on ad hoc warehouse decisions and help keep recoverable inventory from sitting unresolved.
Returnless Refunds and Consolidated Drop-Off
Sometimes, shipping an item back costs more than the value the store can recover. In that case, a returnless refund may preserve more margin than paying for the label, handling, and likely markdown. Set a threshold by product and customer history, document the rule, and apply it consistently. Case-by-case decisions invite uneven treatment and can make the policy harder to manage.
Transport choices affect both cost and customer effort. Consolidated drop-off points and parcel lockers can lower per-return transport costs while keeping the return process relatively easy for customers. These options do not make every return cheaper or suit every store, so compare their operating cost with the convenience they provide. The aim is to reduce unnecessary individual carrier trips without creating extra friction that harms repeat purchase.
Measure Recovery, Not Just Rate
Return rate alone cannot show whether the operation is protecting margin or tying up cash in stock that has not been processed. Track these measures alongside it:
- Recovery value per returned unit: resale revenue divided by units received.
- Days from receipt to resale: how quickly the team grades, routes, and reprices returned items.
- Avoided transport: returnless refunds and consolidated drop-offs recorded over time.
- Repeat purchase after a return: whether the handling experience supports another purchase.
Write a disposition rule for each of the store's top return conditions, and give one owner authority to apply each rule at the bench. Waiting for a manager to decide can delay resale and reduce the value of returned stock. Judge each route by the margin it recovers and its effect on repeat purchase, not by the number of returns it processes.
Three Store Types and Their Different Return Problems
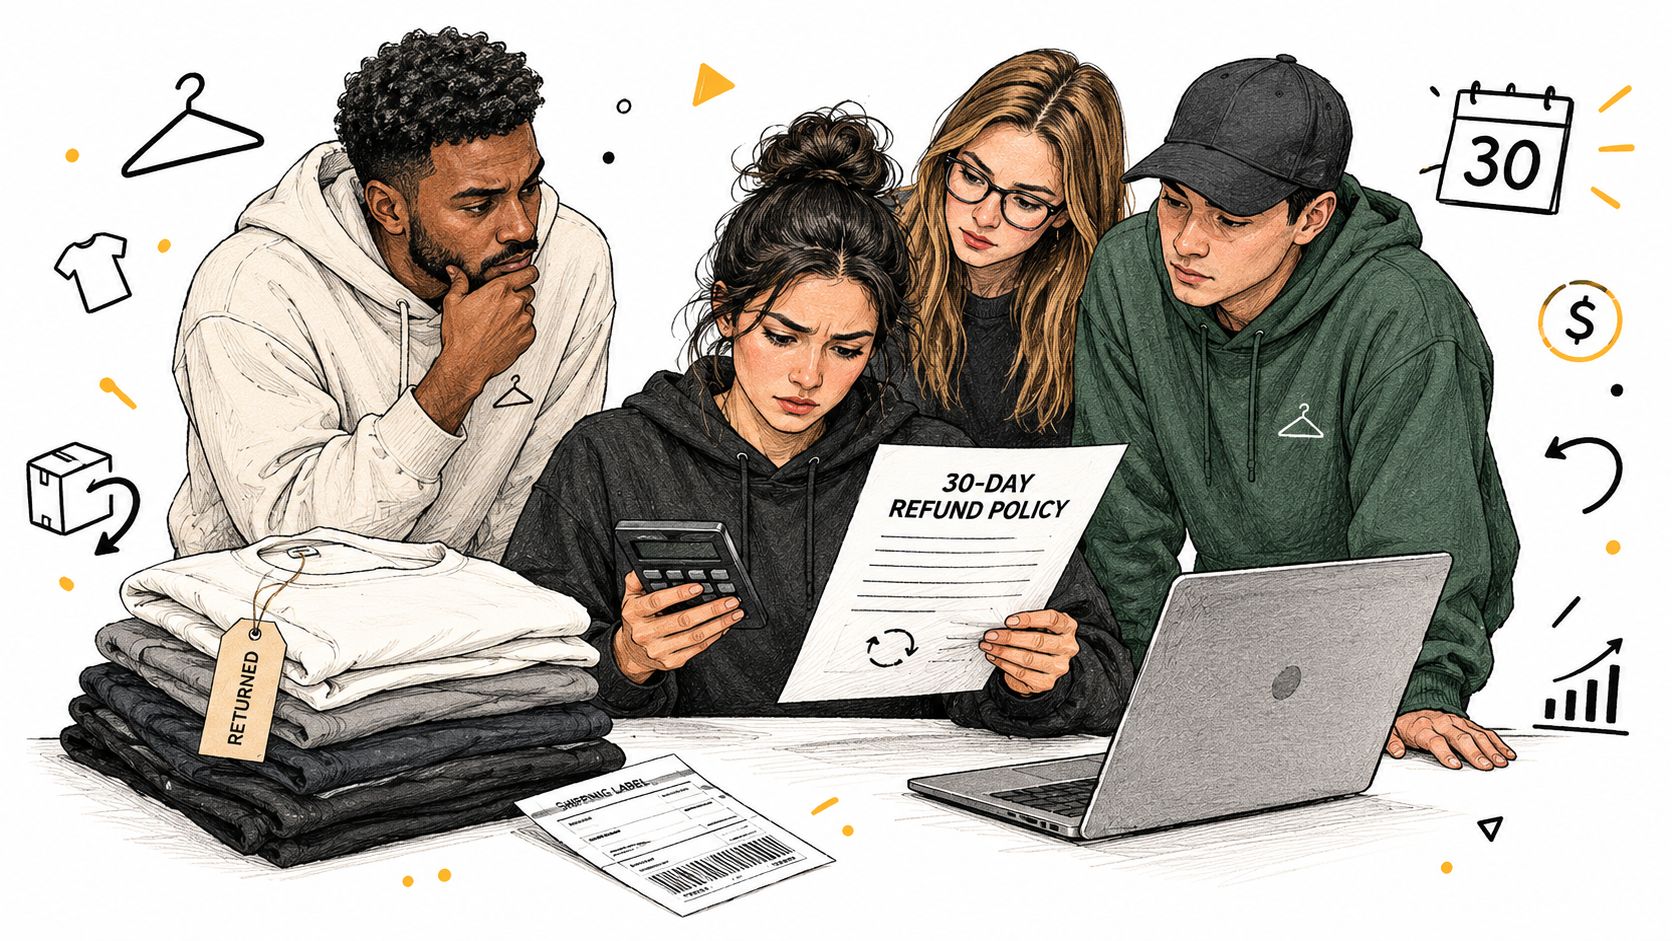
Say an apparel brand reviews a season of returns and finds most are size complaints on a handful of styles. The team's 30-day refund policy looks reasonable on paper, yet the true cost isn't the labels. It's graded stock arriving back too late to sell at full price, while support answers sizing questions the product pages should've settled. Returns are customer feedback you pay to receive. The reason code tells you which lever to pull, and the right lever depends on what you sell.
The scene below captures that review moment, policy document on one side and returned stock on the other.
Store Types, Dominant Return Reasons and Fixes
| Store type | Dominant return reason | Policy move | Metric to watch |
|---|---|---|---|
| Apparel brand | Size and fit | Measured size charts, fit notes, exchange-first flow | Exchange rate against refund rate |
| Consumer electronics | Defects, 'not as expected', buyer's remorse | Restocking fee above a price threshold, compatibility content | Defect versus preference return split |
| Supplements or cosmetics | Opened items, taste or result dissatisfaction | Exclude opened items, satisfaction exchange on unopened goods | Repeat purchase after a return |
Apparel lives and dies on fit. The customer usually wants the product, just in another size, so the economics favor exchanges over refunds. Measured charts and fit notes reduce how often the wrong size ships, and an exchange-first flow saves the sale when it still does. Watch your exchange rate against your refund rate. A rising exchange share at the same return rate is genuine progress, because revenue survives and only shipping is lost.
Consumer electronics has three different problems wearing one label. A defect is a quality or supplier issue, and charging that customer a fee is how you earn a chargeback and a public complaint. "Not as expected" is a content failure, usually compatibility or capability the page didn't state plainly. Buyer's remorse on an expensive opened item is where a restocking fee above a set price threshold belongs, with defects explicitly exempt. The metric that matters is the split between defect and preference returns. Without it, you'll apply a remorse solution to a quality problem.
Consumables can't resell the problem away. An opened supplement or cosmetic has no open-box route, so prevention and policy clarity carry the whole load. Exclude opened items in plain language before checkout, offer a satisfaction exchange on unopened goods, and make first orders easy to size correctly with starter quantities. Track repeat purchase after a return, because a customer who exchanges a flavor and reorders monthly is worth more than the unit you wrote off.
One rule transfers across all three. Match the lever to the reason code, not to the average return rate. Averages tell you returns exist. Reasons tell you what to do.
Start With a Return Reason Audit
You don't need a new policy first. You need to know which avoidable cost is largest, then prove a fix works. Run this audit before you change anything customers see:
- Export 90 days of returns with order, product, category, channel, and reason code.
- Tag each return as avoidable or unavoidable. Size, description gaps, and damage in transit are avoidable. Pure buyer's remorse with no product fault usually isn't.
- Calculate return rate and cost per return by category, using your shipping, label, handling, and resale figures.
- Rank categories by total avoidable cost, not by rate. Volume times cost per return decides priority.
- Choose one lever for the top category, such as a size guide, an exchange-first flow, or a restocking fee.
- Test it on that category alone for four to six weeks, tracking conversion, repeat purchase, margin, and support contacts together.
If your audit shows size, color, or address corrections driving tickets that later become returns, that's an order editing problem, not a returns problem. A self-service tool such as SelfServe from ServeApps lets customers fix those details within rules you set, and relevant product recommendations made during order editing convert at 3-5x the rate of a static thank-you page upsell. Top Nutrition reports a 12.4x ROI and 82 self-service edits with SelfServe. Treat those figures as a hypothesis and test them against your own edit volume and ticket counts.
Reduce avoidable returns before they become shipments by letting customers correct size, variant, quantity, and address details themselves within windows you control, while keeping exchanges and repeat purchases in view. ServeApps builds Shopify-native self-service order editing, cart, and upsell tools that cut support tickets and protect margin through the post-purchase process. Visit ServeApps to see how SelfServe fits your store and start with the category your return reason audit ranks first.
Shopify Store Credits: Issuing, Redeeming and Accounting
Learn what Shopify store credits are, how they differ from gift cards and refunds, and how to issue, redeem and account for them.
Read more →
Can You Have Multiple Stores on Shopify? Plans and Limits
Can you have multiple stores on Shopify? Yes, through organizations or Plus expansion stores. Compare plan limits, eligibility and setup tips.
Read more →
Product Customizer App Shopify: Choosing the Right Tool
Compare native and third-party product customizer app shopify options on speed, theme support, variant mapping and SKUs before you install one.
Read more →