
70.22% of online shopping carts are abandoned before purchase, the average Baymard Institute calculated from 50 studies spanning 2006 to 2025 (Baymard's cart abandonment list). That number usually gets quoted as a warning about persuasion, as if shoppers need more convincing. It reads better as a diagnostic signal. When seven in ten carts end without an order, the cause is rarely a shopper who changed their mind and almost always a specific, nameable obstacle sitting in the flow.
Checkout process optimization works when you treat it that way, as a funnel with causes you can rank instead of a page you restyle. Each cause leaves a signature in your data, has a fix that addresses it directly, and has a metric that tells you whether the fix held. The discipline is sequence and evidence, not taste.
Table of Contents
- Why Shoppers Abandon Checkout and What Fixes Each Reason
- How to Audit Checkout Friction in Five Steps
- Which Form Fields and Steps to Cut First
- Fixing Payment Method and Payment Failure Problems
- Building Trust Through Guest Checkout and Delivery Clarity
- Testing Checkout Changes Without Losing Revenue
- Pick Your Three First Checkout Fixes
Why Shoppers Abandon Checkout and What Fixes Each Reason
The persistence matters more than the average. Across Baymard Institute's aggregate of 50 studies published between 2006 and 2025, individual abandonment rates run from 55% to 84%, and the fact that the range hasn't collapsed tells you friction is assembled into checkouts by default rather than caused by one device, one country or one retail category (Baymard Institute's cart abandonment research). Eighteen years of redesigns, faster connections and better payment rails haven't moved it.
Baymard also asked U.S. online shoppers why they left, excluding those who were only browsing. The answers rank cleanly, and each points at a different part of the flow: 48% cited unexpectedly high extra costs such as shipping, taxes or fees, 24% objected to being required to create an account, 22% found delivery too slow, 18% didn't trust the site with their payment-card details, and 17% considered the checkout too complicated or too long.
Read that as a triage order, because every reason has a matching remedy:
| Reason for leaving | Share of abandoners | Fix to test |
|---|---|---|
| Unexpectedly high extra costs (shipping, taxes, fees) | 48% | Show full cost before the payment step |
| Required to create an account | 24% | Offer guest checkout as the default path |
| Delivery too slow | 22% | Show delivery dates on the cart and product pages |
| Did not trust the site with card details | 18% | Add security cues and recognised payment options at payment |
| Checkout too complicated or too long | 17% | Remove fields and steps that do not affect the order |
The five reasons and their fixes, condensed into one view:
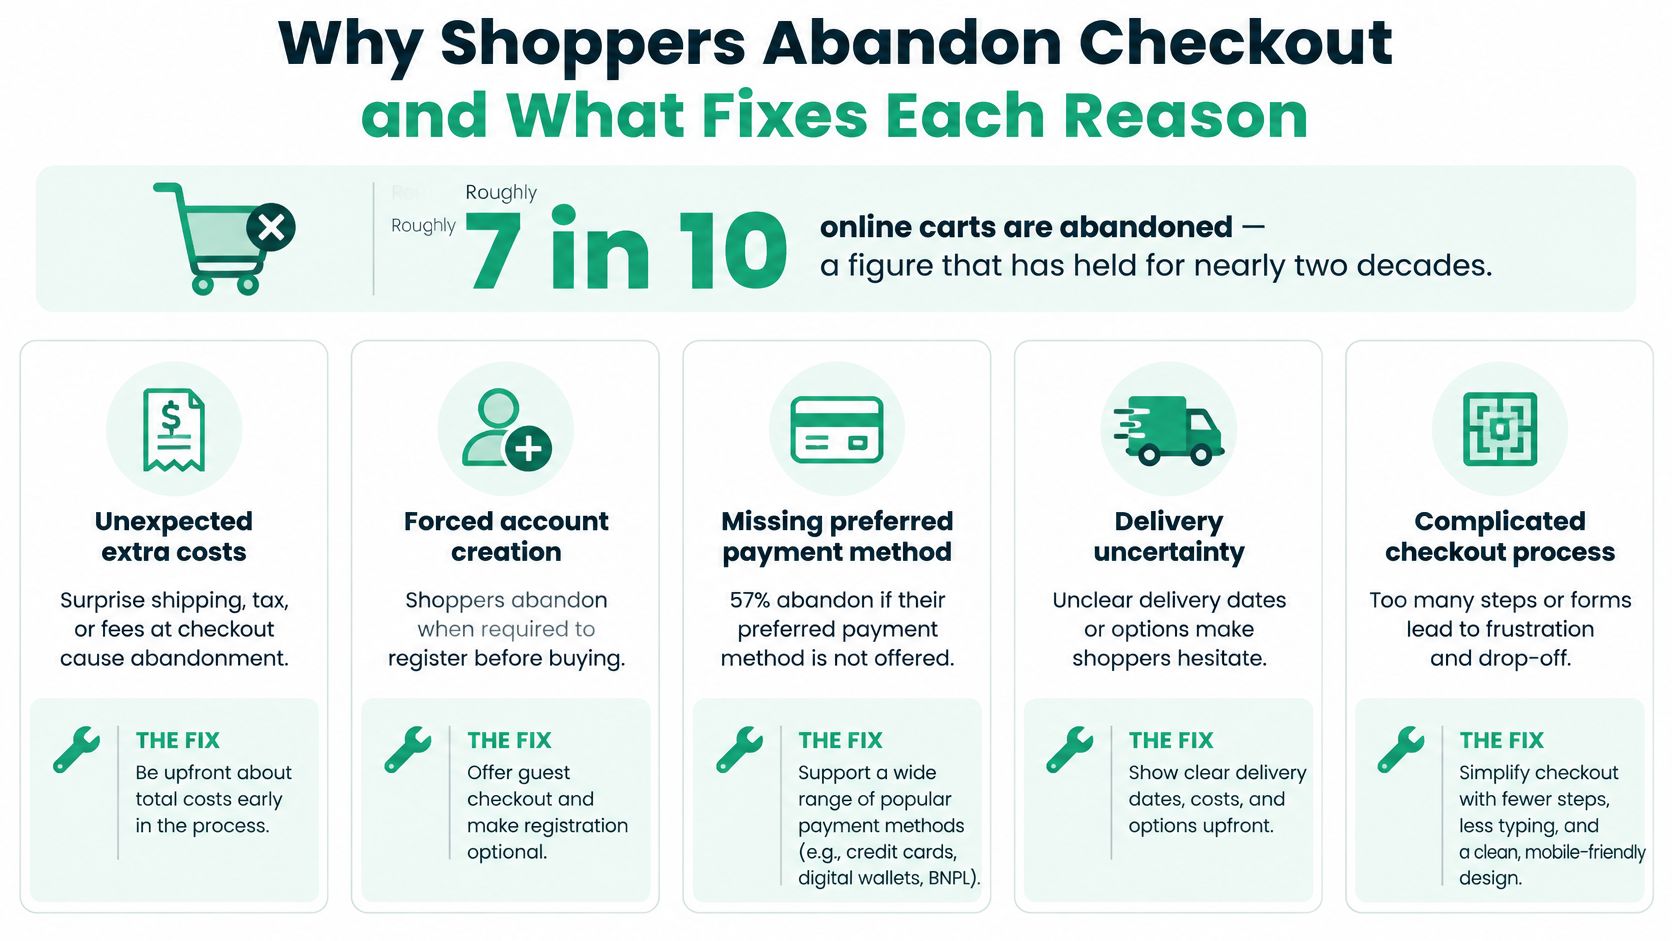
Cost transparency sits at the top for a reason. It's the objection a shopper cannot resolve on their own, and it's the one that makes them feel tricked after they've already invested time. Forced registration is the opposite kind of problem: a business preference dressed up as a requirement, and entirely within your control.
What the benchmark audit adds
The reasons explain individual decisions. A second body of work explains why the fixes are still sitting undone at most stores. Baymard benchmarked 344 leading ecommerce sites in the United States and the European Union against more than 110 cart-and-checkout usability guidelines and found that 65% performed at a mediocre level or worse, only 35% reached a decent-or-better rating, and just 2% were rated good (Baymard's checkout usability benchmark). The average site had 32 distinct checkout improvements available, and the same benchmark estimated that a large ecommerce site could achieve a 35.26% increase in conversion rate by addressing documented checkout-usability problems. That's a relative improvement measured against a tested set of fixes, not a promise for your store.
The practical read: your checkout most likely carries several fixable causes at once, and they're the same causes your competitors carry. Before you go further, pull your abandonment survey or exit data and note which of the five reasons appears most often in it. That ordering is the input to everything below.
How to Audit Checkout Friction in Five Steps
The method below borrows from the deepest checkout research available: 272 moderated usability sessions, eye-tracking, more than 850 benchmarked checkout steps and nine quantitative studies covering 11,777 participants sit behind Baymard's guidelines (Baymard's ecommerce checkout usability report and benchmark). A five-step audit runs the same sequence at a fraction of that budget.
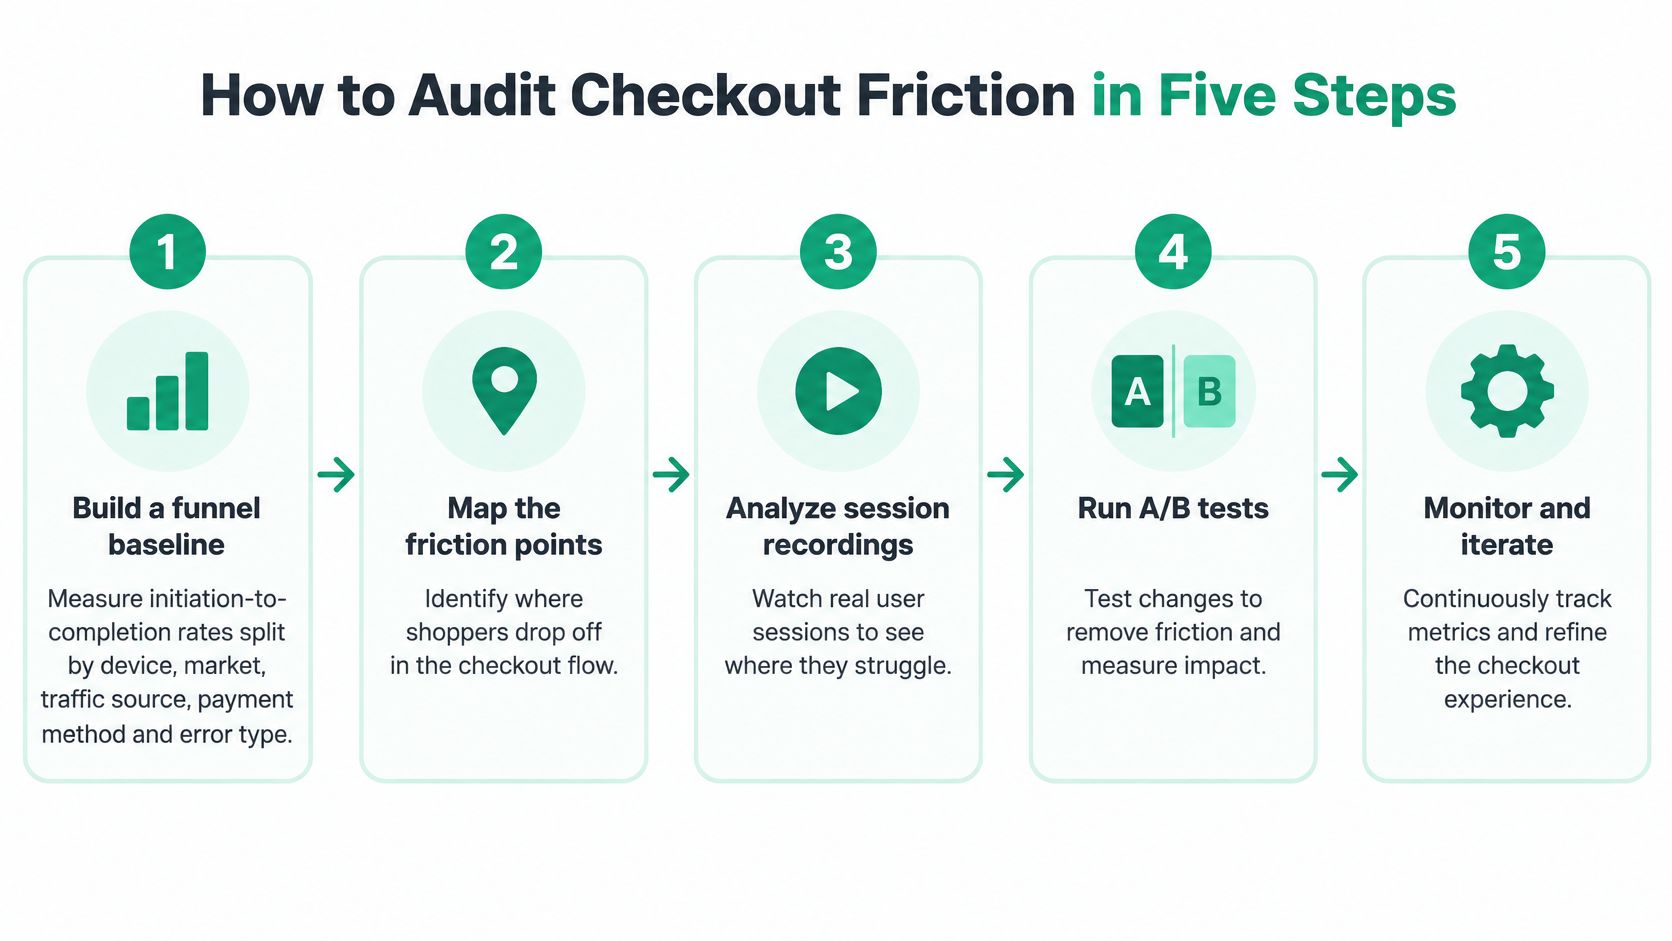
- Build a funnel baseline before anything else. Measure initiation-to-completion rates split by device, market, traffic source, payment method and error state. A blended rate hides the segment that is failing, and the priority list changes completely depending on whether the leak is mobile Safari, one market's card declines or a postcode validation bug. The output is a ranked list of leaks, each with a segment attached.
- Watch five to eight real purchases. Moderated sessions with customers completing a typical order surface the hesitation, the re-typing and the back-button panic that analytics cannot see. Five sessions usually repeat the same three problems, which is enough to act on.
- Classify each friction point into one of six types. Unnecessary fields, unclear labels, validation failures, surprise costs, account requirements, payment failures. Classification forces a count, and the count assigns each fix to an owner. Expect a skewed result: most checkouts ask for roughly twice as many fields as the order needs, and the excess is structural, baked into defaults nobody revisited.
- Pull field-level error logs. Rank inputs by validation-failure volume, then by what happens downstream of each failure. Postcode and phone formats usually lead, and an apartment-line field that rejects punctuation can kill a whole market's worth of orders. The log tells you which field to fix first. The session recordings tell you why shoppers hit it.
- Test one material change at a time. Hold traffic mix and checkout eligibility constant for the full test period. Two simultaneous changes produce a result you cannot attribute, which means the same decision gets re-argued in six months.
Where audits go wrong
Three failure modes account for most audits that produce a report nobody acts on. Testing only desktop traffic is the first, because the segment you never looked at is often the one dragging the average down. The second is collapsing or removing fields without checking address-validation accuracy, which trades a visible conversion problem for an invisible fulfilment one. The third is reporting a conversion gain without monitoring refunds, failed payments, support contacts or fulfilment defects, all of which can absorb the gain before it reaches the P&L.
Practical rule: audit the worst-performing segment before you touch the shared flow. A fix aimed at the blended average usually helps nobody, and it sometimes breaks the segment that was already converting.
A healthy baseline looks boring: a completion rate that is stable across devices, no segment more than a few points below the rest, a failed-payment rate that is flat by method, and support contacts per 100 orders that are holding steady. Get to boring, then start optimizing.
Which Form Fields and Steps to Cut First
Most checkout advice starts with a field count and works backwards from there. The better starting point is function. A field earns its place if it changes what happens to the order: fulfilment, tax, fraud screening, payment authorization or a legally required communication. Everything else is a preference, and preferences belong after the order is placed, not between a shopper and the buy button.
Sort every field by function
That test produces three actions rather than one. Keep what the order depends on, prefill what you can infer, and move or remove what serves marketing or internal reporting.
| Field or step | Affects fulfilment, tax, fraud, payment or legal? | Action |
|---|---|---|
| Email address | Yes (order confirmation, legal notices) | Keep |
| Shipping address | Yes (fulfilment, tax) | Keep, add autocomplete and validation |
| Phone number | Only if the carrier requires it | Keep if required, otherwise make optional |
| Billing address when same as shipping | Partly (tax and fraud checks) | Prefill by default |
| Company name | No | Move behind an optional toggle |
| Gift message | No | Move to the order status page |
| Newsletter opt-in checkbox | No | Remove from checkout |
| Account password | No for guest orders | Defer to after purchase |
Prefill is the cheapest win in the whole form, because it removes typing without removing information. Billing copied from shipping, city and country derived from the postcode, card type read from the first digits: each one cuts visible effort while keeping the data your operations team needs.
Say a store drops a mandatory company field and a newsletter checkbox in one release. Completion ticks up, and the more interesting result is that postcode validation errors fall as well. Fewer competing inputs means the address field gets the attention it needs, and autocomplete suggestions get accepted instead of typed over.
That's the outcome to watch for. Removing a field without checking address accuracy can push errors downstream into fulfilment, where a re-shipment or a failed delivery costs more than the order was worth. Compare address match rates before and after the change, not just completion rate.
Fixing Payment Method and Payment Failure Problems
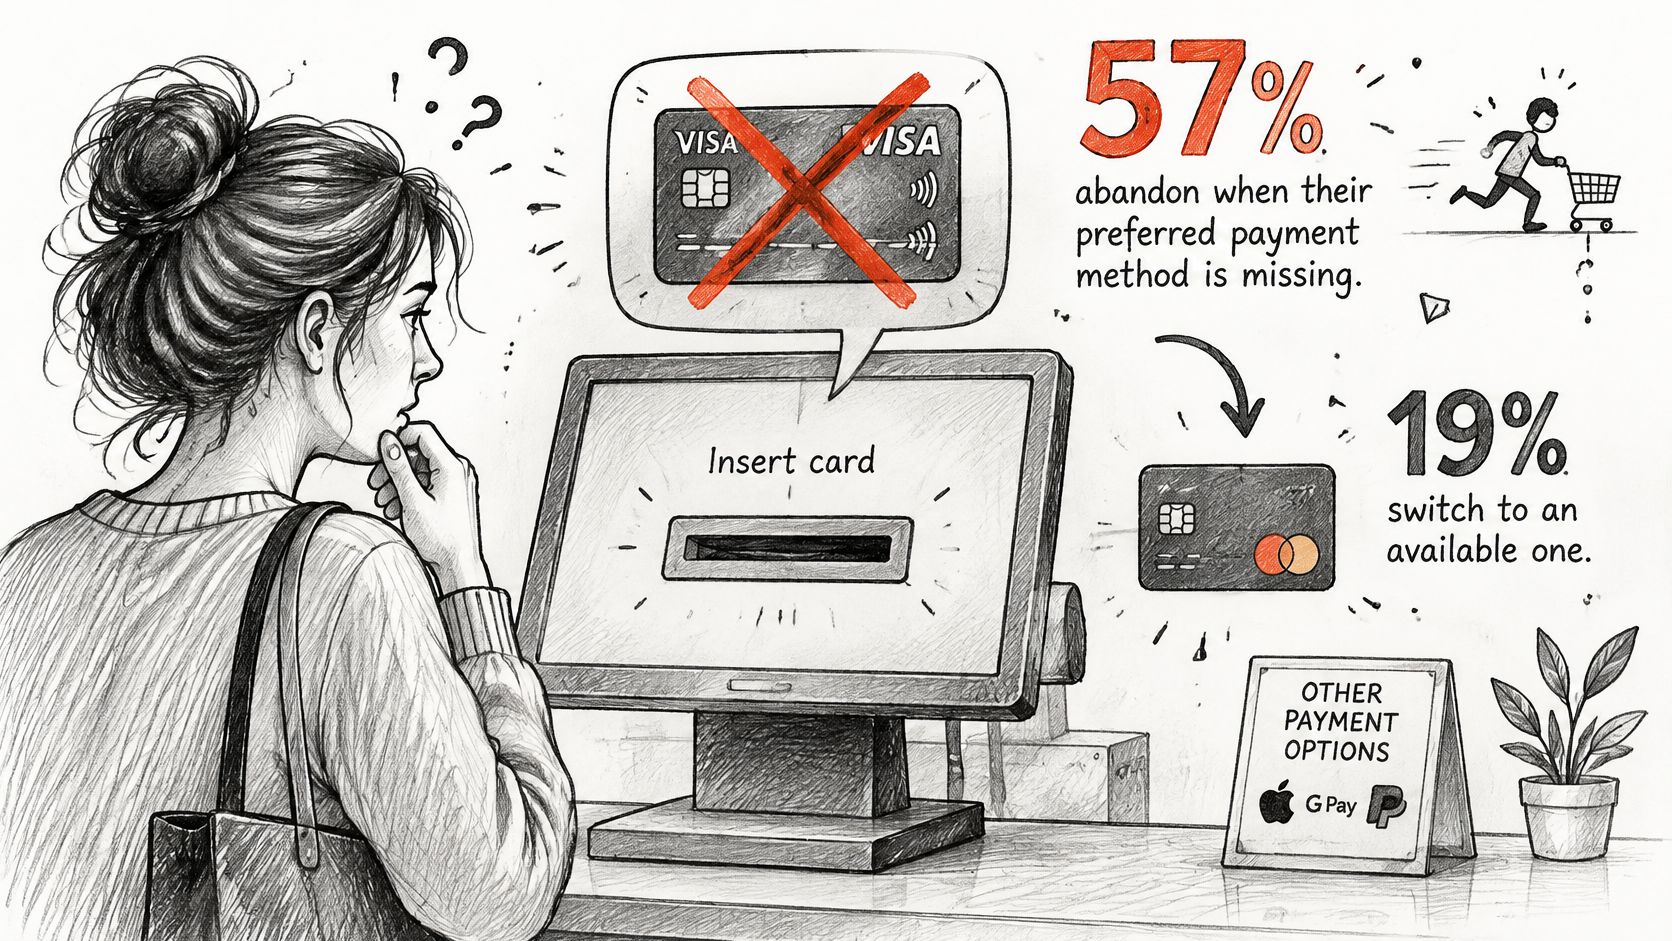
Payment is where a checkout's assumptions meet reality, and the numbers are less forgiving than the standard advice implies. Reporting on consumer checkout expectations found that 57% of consumers who can't find their preferred payment method abandon the purchase, while only 19% switch to an available alternative and complete it (Hyperswitch's report on consumer checkout expectations). That undercuts the tidy story that the leanest payment menu always wins.
It doesn't license showing everything either. Local adoption, authorization rates, fees, settlement timing, fraud exposure, refunds and how the options render on a phone all shape net contribution margin, and a method nobody in a market uses is pure interface cost. The image below captures the moment the decision gets made:
Separate visibility from reliability
A method that isn't shown is a visibility problem. A method that is shown but fails is a reliability problem. They need different reporting: attempted checkouts, successful authorizations, declines, retries, refunds, chargebacks and contribution margin, each tied to a method and a market. Most dashboards stop at conversion rate by method, which blends the two and sends teams to the wrong fix.
Use the symptom the shopper leaves behind to pick the investigation:
| Symptom | Likely cause | Fix |
|---|---|---|
| Buyer leaves at payment with no error | Preferred payment method missing | Rank available methods by market and basket size |
| Generic decline message | Issuer decline or risk challenge | Show a specific message and offer an alternate method |
| Payment spins then times out | Technical timeout | Log gateway timeouts and keep the cart intact |
| Drop-off after 3-D Secure prompt | Authentication abandonment | Test the challenge on mobile and shorten the flow |
| Coupon or code rejected | Validation logic | Show the reason the code failed next to the field |
Ranking methods by market only works when currencies and local options are configured deliberately. Our guide to setting up multi-currency and international payment options for Shopify merchants covers the configuration decisions sitting underneath the payment menu.
One rule outranks the rest: the cart has to survive every failed attempt, with items, address and method selection intact. For a brand selling across several markets, payment availability is usually worth more than trimming one or two fields.
Building Trust Through Guest Checkout and Delivery Clarity
Trust appears in checkout as a set of checkable conditions rather than a badge in the footer. Three conditions carry most of the weight.
Guest checkout as the default path. Registration objections rank near the top of the abandonment list, so make guest the primary, high-contrast button on the entry screen and treat sign-in as the secondary route. Collect the email, ship the order, then invite account creation on the confirmation page with the order prefilled and a single password field. You get the account data either way; the shopper doesn't pay for it with friction.
Delivery clarity. Put the estimated delivery date and the dispatch cut-off on the cart and the product page, not only at shipping selection. A shopper who has to reach the fifth step to learn the parcel arrives after the date they needed it has already decided to leave.
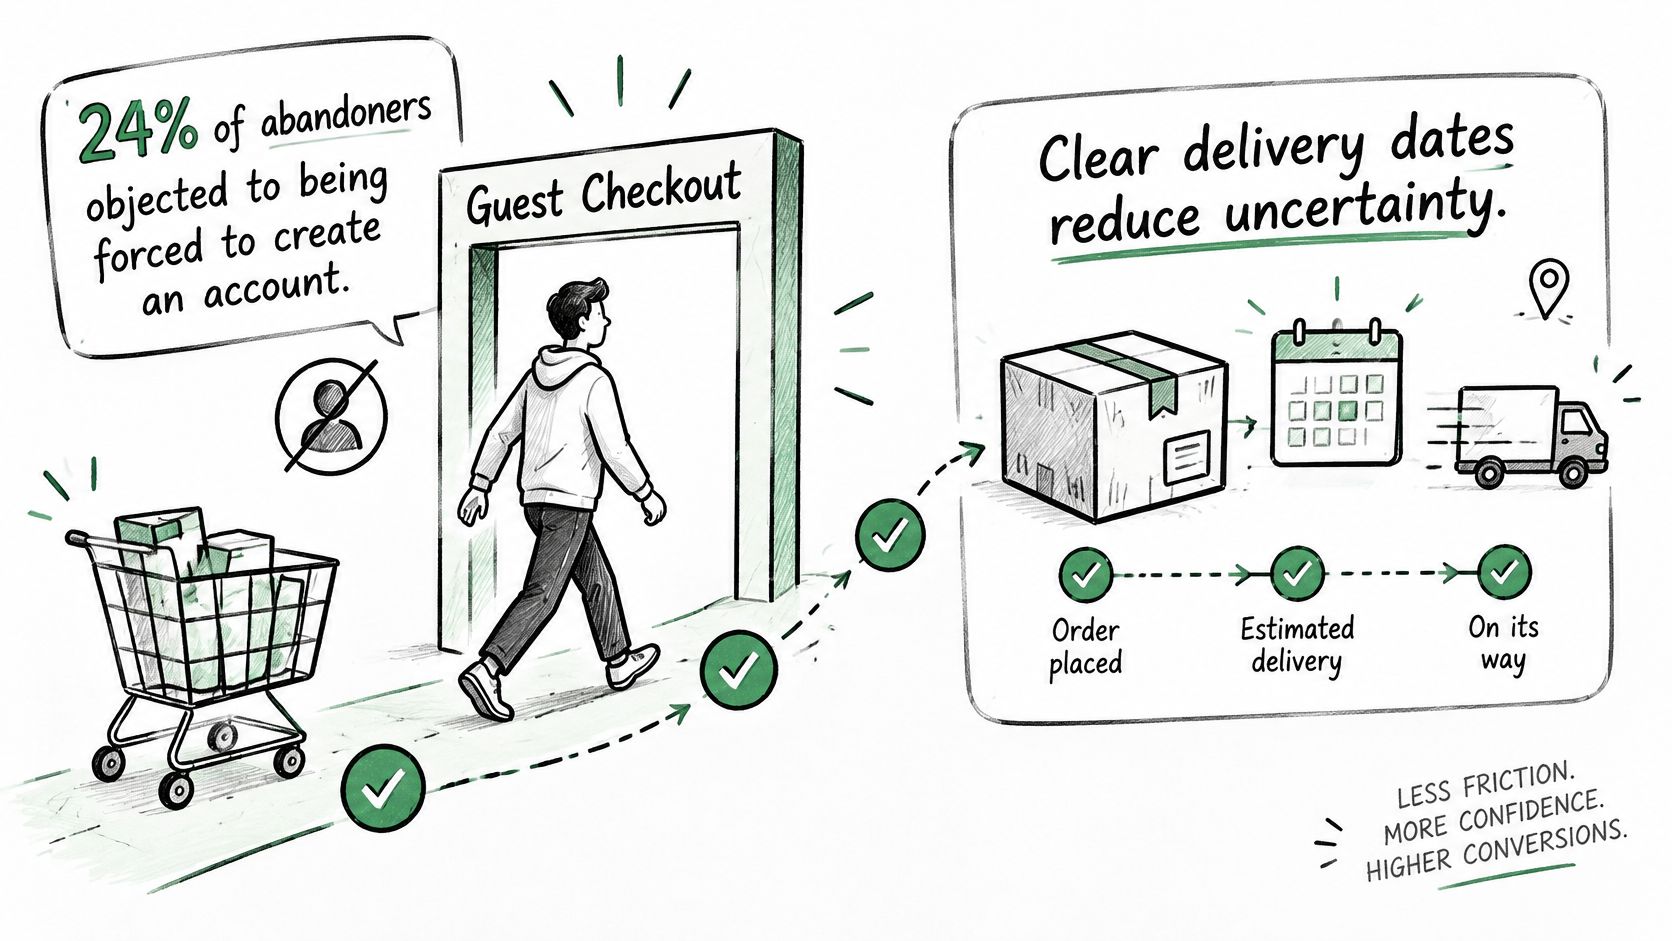
Payment confidence. Recognised payment logos and a plain security statement belong beside the card fields, where the anxiety happens. Keep the layout stable through submission so the shopper can see the order progressing instead of wondering whether the click registered.
Signals worth testing, one at a time:
- Returning-email recognition: offer saved addresses when an email matches an existing customer.
- Delivery date on the cart line: tested against a generic shipping estimate.
- Security statement next to the card field: not a badge buried in the footer.
- Return policy summary near the order button: two sentences, plain language.
- Order status preview: show what happens after the click, including how edits work.
Bundle these and you get a number nobody can attribute. Test them separately and the one that mattered stays visible. The dispatch side of the same promise is covered in shipping and fulfillment best practices for Shopify merchants.
Testing Checkout Changes Without Losing Revenue
Run one material change at a time, split traffic randomly, and hold checkout eligibility and traffic mix constant for the full period. That's the method. Everything else is instrumentation.
The metrics that catch a false win
A completion-rate chart will happily show a gain that costs you money. Review six numbers for every test:
| Metric | What it reveals | Warning sign |
|---|---|---|
| Initiation-to-completion rate by device and market | Conversion effect across segments | Gain on desktop, drop on mobile |
| Failed payment rate by method | Payment reliability after the change | Declines rise after a layout or field change |
| Refund rate | Whether buyers felt surprised | Refunds rise after costs are shown earlier |
| Support contacts per 100 orders | Hidden friction | Spike in questions about address or shipping |
| Average order value | Quality of the extra conversions | Conversion up while order value falls |
| Fulfilment defects | Operational cost of the change | Address errors rise after fields are removed |
Each row pairs a headline number with the number that contradicts it. A desktop gain alongside a mobile drop is a layout regression, not an optimization. Declines that climb after a layout change point at the payment integration rather than at buyer intent. Refunds rising after you moved costs earlier means shoppers felt misled by something else on the page. Address errors climbing after a field removal means validation was doing work you didn't know about.
A conversion gain that lowers average order value or raises support contacts isn't a win. It's a cost you moved somewhere the dashboard doesn't look.
Set the stopping rule before launch
Decide in advance how many completed checkouts each variant needs before you'll call it, and hold to it. Stopping when the chart looks good is how teams ship noise. Confirm the result with a standard significance check before rebuilding the flow around it, then record the outcome, the date and the traffic conditions in one place so the next quarter's team can see which wins held.
For test design around these interventions, conversion rate optimization for Shopify tips that actually work covers hypothesis writing and sample planning.
Pick Your Three First Checkout Fixes
The benchmark's headline uplift figure is an opportunity estimate for a large site, not a forecast for yours. Treat it as a reason to sequence the work rather than a budget line.
Rank what the audit found with one calculation:
- List every friction point with its abandonment volume. Use sessions or orders lost in a period, not a percentage, so fixes at different steps become comparable.
- Estimate effort in developer days or app changes. Include QA and analytics work. A fix you can't measure is a fix you can't defend.
- Divide volume by effort and sort descending. The top of that list is where the next sprint goes.
For most stores the first three are the same three: show the full cost before the payment step, make guest checkout the default path, and remove or defer every field that doesn't affect the order.
Take a store that starts with cost disclosure. It ships the change, then watches refunds and support tickets for a month before touching anything else. Nothing moves, completion rate climbs, and the next fix starts from a clean baseline instead of a blended one.
Post-purchase matters for the same reason. When customers can change an order without emailing support, fewer orders get cancelled or reworked, and merchants running order editing and cancellations together see cancellation rates fall by 30 to 40%. That shows up in the support-contacts metric, which is why it belongs in the review rather than in a separate project.
Choose three fixes, attach the metrics from the testing section to each, and book the four-week review before you start. The review is what turns a list of fixes into a checkout process optimization program that compounds.
ServeApps builds Shopify apps for the half of this problem that happens after the order lands. SelfServe puts order editing, address changes and cancellations on the customer's own order status page, CartServe builds a no-code cart drawer, and UpServe runs contextual add-to-cart offers with per-popup revenue analytics. If your audit points at post-purchase friction rather than the form, start at ServeApps.
What Is Upsell? Examples and How Shopify Stores Use It
What is upsell? Learn the definition, how it differs from cross-selling, and how Shopify stores use upsells to raise order value.
Read more →
Increase Conversion Rate on Website: 9 Proven Cart Tactics
Increase conversion rate on website with cart, upsell, and testing tactics. See what lifts AOV, cuts abandonment, and how to apply each one today.
Read more →
8 Self Service Store Examples: Benefits and Tactics
Explore 8 self service store examples, from cashierless checkout to post-purchase portals, with benefits, trade-offs, and tactics you can copy.
Read more →